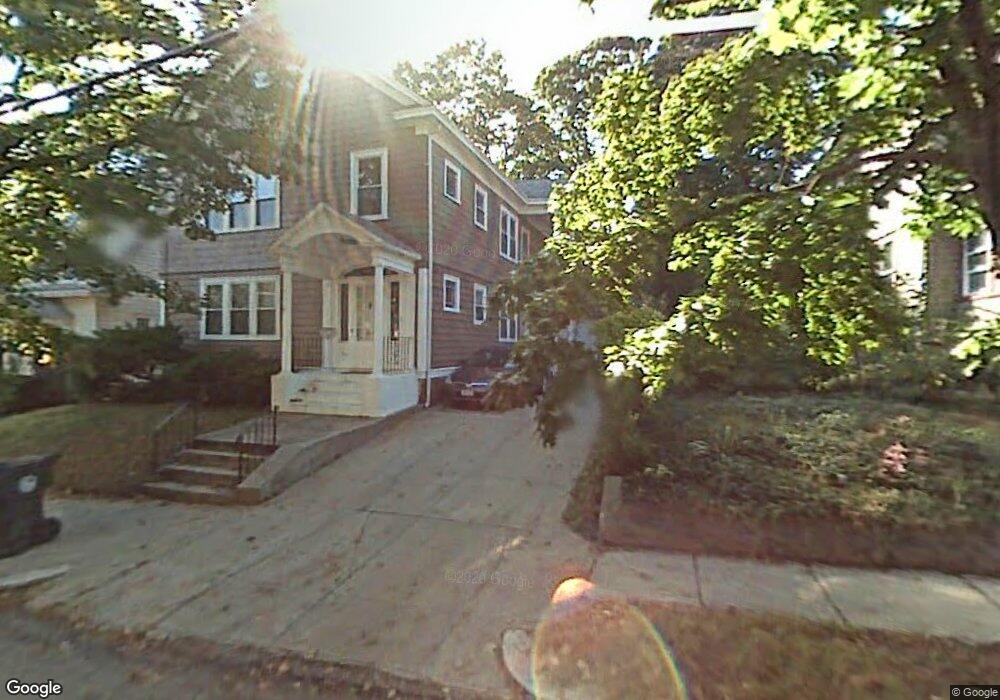
173 8th St Providence, RI 02906
Hope NeighborhoodEstimated Value: $846,060 - $932,000
5
Beds
3
Baths
3,071
Sq Ft
$288/Sq Ft
Est. Value
About This Home
This home is located at 173 8th St, Providence, RI 02906 and is currently estimated at $884,015, approximately $287 per square foot. 173 8th St is a home located in Providence County with nearby schools including International Charter School, Blackstone Academy Charter School, and Jewish Community Day School Of Rhode Island.
Ownership History
Date
Name
Owned For
Owner Type
Purchase Details
Closed on
Apr 20, 2000
Sold by
Dunn Charles M
Bought by
Witwicki Glen A and Witwicki Diamantina
Current Estimated Value
Home Financials for this Owner
Home Financials are based on the most recent Mortgage that was taken out on this home.
Original Mortgage
$130,000
Interest Rate
8.21%
Mortgage Type
Purchase Money Mortgage
Create a Home Valuation Report for This Property
The Home Valuation Report is an in-depth analysis detailing your home's value as well as a comparison with similar homes in the area
Home Values in the Area
Average Home Value in this Area
Purchase History
| Date | Buyer | Sale Price | Title Company |
|---|---|---|---|
| Witwicki Glen A | $180,000 | -- |
Source: Public Records
Mortgage History
| Date | Status | Borrower | Loan Amount |
|---|---|---|---|
| Open | Witwicki Glen A | $119,000 | |
| Closed | Witwicki Glen A | $36,600 | |
| Open | Witwicki Glen A | $286,500 | |
| Closed | Witwicki Glen A | $130,000 |
Source: Public Records
Tax History
| Year | Tax Paid | Tax Assessment Tax Assessment Total Assessment is a certain percentage of the fair market value that is determined by local assessors to be the total taxable value of land and additions on the property. | Land | Improvement |
|---|---|---|---|---|
| 2025 | $10,788 | $770,600 | $369,900 | $400,700 |
| 2024 | $10,293 | $560,900 | $249,300 | $311,600 |
| 2023 | $10,293 | $560,900 | $249,300 | $311,600 |
| 2022 | $9,984 | $560,900 | $249,300 | $311,600 |
| 2021 | $9,903 | $403,200 | $196,600 | $206,600 |
| 2020 | $9,903 | $403,200 | $196,600 | $206,600 |
| 2019 | $9,903 | $403,200 | $196,600 | $206,600 |
| 2018 | $9,204 | $288,000 | $170,100 | $117,900 |
| 2017 | $9,204 | $288,000 | $170,100 | $117,900 |
| 2016 | $9,204 | $288,000 | $170,100 | $117,900 |
| 2015 | $9,093 | $274,700 | $158,800 | $115,900 |
| 2014 | $9,271 | $274,700 | $158,800 | $115,900 |
| 2013 | $9,271 | $274,700 | $158,800 | $115,900 |
Source: Public Records
Map
Nearby Homes
- 136 Hillside Ave
- 80 Hillside Ave
- 62 Harwich Rd
- 39 Harwich Rd
- 540 Blackstone Blvd
- 32 Carver St
- 122 Lowden St
- 202 Rochambeau Ave Unit 2
- 89 Dexterdale Rd
- 139 Lancaster St
- 603 East Ave
- 41 Campbell Terrace
- 36 Auburn St
- 15 Taft Ave
- 410 Pawtucket Ave
- 103 Evergreen St
- 296 Cole Ave
- 101 Grand View St Unit 1
- 94 Larch St
- 186 Camp St Unit 5