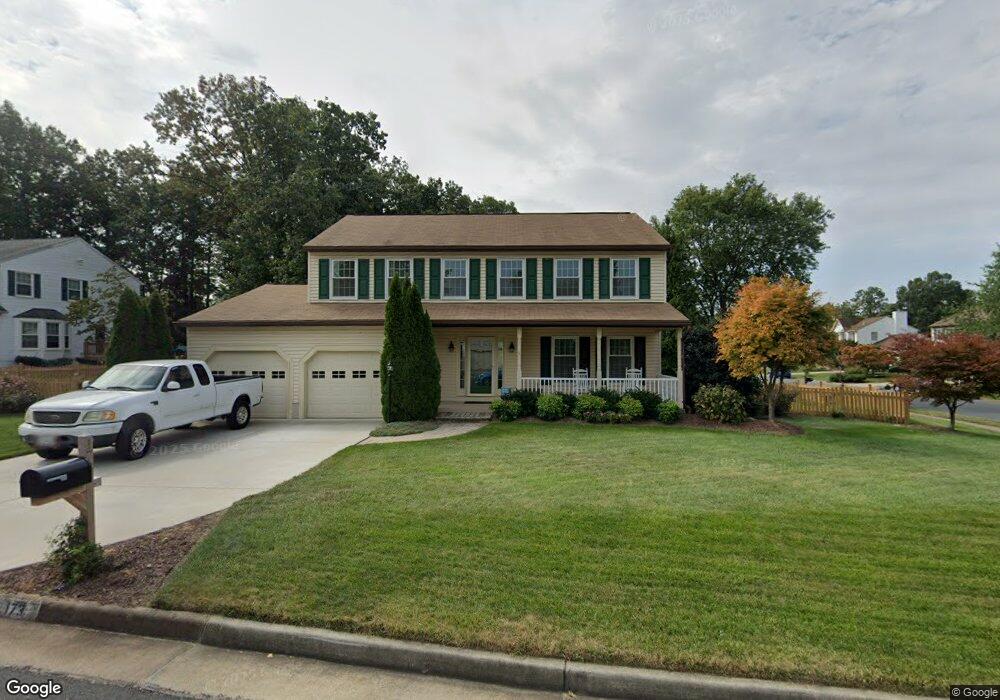
173 Applegate Dr Sterling, VA 20164
Estimated Value: $713,547 - $785,000
4
Beds
3
Baths
2,132
Sq Ft
$354/Sq Ft
Est. Value
About This Home
This home is located at 173 Applegate Dr, Sterling, VA 20164 and is currently estimated at $753,887, approximately $353 per square foot. 173 Applegate Dr is a home located in Loudoun County with nearby schools including Forest Grove Elementary School, Sterling Middle School, and Park View High School.
Ownership History
Date
Name
Owned For
Owner Type
Purchase Details
Closed on
Nov 30, 2009
Sold by
Kendi Thomas A
Bought by
Newsome Anita
Current Estimated Value
Home Financials for this Owner
Home Financials are based on the most recent Mortgage that was taken out on this home.
Original Mortgage
$373,117
Outstanding Balance
$242,743
Interest Rate
4.85%
Mortgage Type
FHA
Estimated Equity
$511,144
Purchase Details
Closed on
Nov 3, 2000
Sold by
Cyr Claude
Bought by
Balog Steve
Home Financials for this Owner
Home Financials are based on the most recent Mortgage that was taken out on this home.
Original Mortgage
$204,000
Interest Rate
7.83%
Create a Home Valuation Report for This Property
The Home Valuation Report is an in-depth analysis detailing your home's value as well as a comparison with similar homes in the area
Home Values in the Area
Average Home Value in this Area
Purchase History
| Date | Buyer | Sale Price | Title Company |
|---|---|---|---|
| Newsome Anita | $380,000 | -- | |
| Balog Steve | $255,000 | -- |
Source: Public Records
Mortgage History
| Date | Status | Borrower | Loan Amount |
|---|---|---|---|
| Open | Newsome Anita | $373,117 | |
| Previous Owner | Balog Steve | $204,000 |
Source: Public Records
Tax History
| Year | Tax Paid | Tax Assessment Tax Assessment Total Assessment is a certain percentage of the fair market value that is determined by local assessors to be the total taxable value of land and additions on the property. | Land | Improvement |
|---|---|---|---|---|
| 2025 | $5,718 | $710,250 | $234,400 | $475,850 |
| 2024 | $5,643 | $652,350 | $224,400 | $427,950 |
| 2023 | $5,239 | $598,690 | $224,400 | $374,290 |
| 2022 | $5,100 | $573,000 | $189,400 | $383,600 |
| 2021 | $5,128 | $523,220 | $179,400 | $343,820 |
| 2020 | $5,093 | $492,090 | $154,400 | $337,690 |
| 2019 | $4,918 | $470,590 | $154,400 | $316,190 |
| 2018 | $5,013 | $462,050 | $139,400 | $322,650 |
| 2017 | $4,922 | $437,490 | $139,400 | $298,090 |
| 2016 | $4,925 | $430,170 | $0 | $0 |
| 2015 | $4,887 | $291,170 | $0 | $291,170 |
| 2014 | $4,878 | $282,970 | $0 | $282,970 |
Source: Public Records
Map
Nearby Homes
- 229 Applegate Dr
- 12807 Scranton Ct
- 12807 Lady Fairfax Cir
- 12819 Fantasia Dr
- 1606 Blacksmith Ln
- 503 S Maple Ct
- 1686 Winterwood Ct
- 12815 Briery River Terrace
- 1120 Stevenson Ct
- 1081 Trevino Ln
- 45909 Old ox Rd
- 22070 County Rd 254l Rd Unit Lots 23, 24, 25 & 26
- 1534 Youngs Point Place
- 1191 Monroe St
- 1543 Youngs Point Place
- 101 S Harrison Rd
- 200 Williamsburg Rd
- 1257 Magnolia Ln
- 1314 E Holly Ave
- 102 N Duke Dr
- 114 Briarwood Ct
- 171 Applegate Dr
- 108 Briarwood Ct
- 116 Briarwood Ct
- 164 Applegate Dr
- 111 Briarwood Ct
- 113 Briarwood Ct
- 169 Applegate Dr
- 109 Briarwood Ct
- 115 Briarwood Ct
- 118 Briarwood Ct
- 106 Briarwood Ct
- 107 Briarwood Ct
- 302 Bradford Ct
- 167 Applegate Dr
- 304 Bradford Ct
- 203 Pin Oak Ct
- 117 Briarwood Ct
- 306 Bradford Ct
- 120 Briarwood Ct