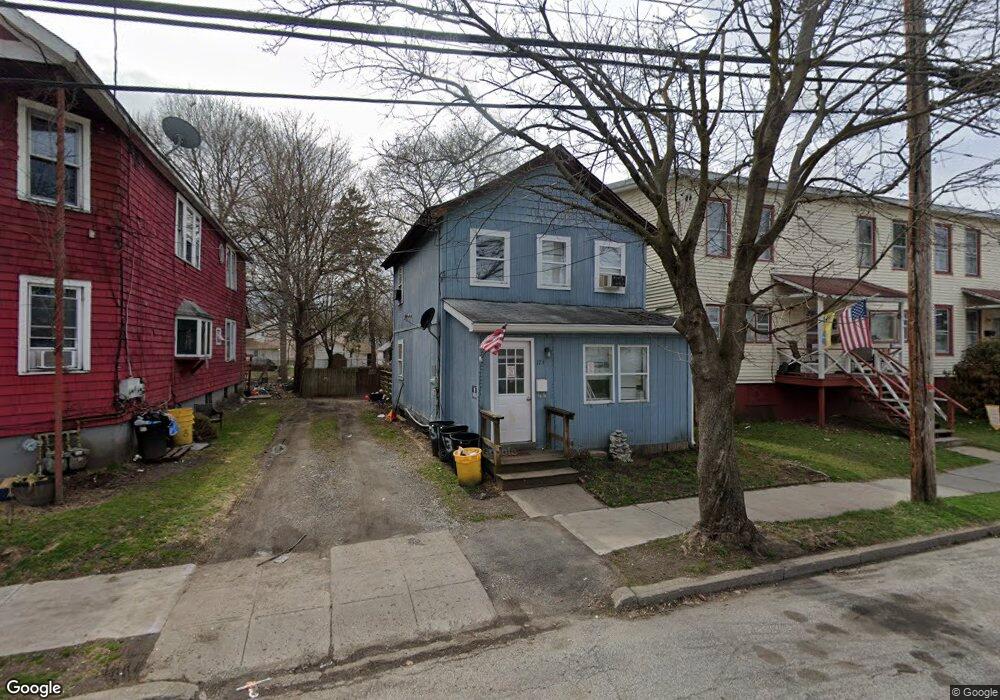
173 Ball St Port Jervis, NY 12771
Estimated Value: $150,000 - $228,859
3
Beds
1
Bath
1,014
Sq Ft
$187/Sq Ft
Est. Value
About This Home
This home is located at 173 Ball St, Port Jervis, NY 12771 and is currently estimated at $189,965, approximately $187 per square foot. 173 Ball St is a home located in Orange County with nearby schools including Port Jervis High School and New Life Christian Day School.
Ownership History
Date
Name
Owned For
Owner Type
Purchase Details
Closed on
Jan 31, 2023
Sold by
Hums Preston W and Hums Gloria J
Bought by
Perfect Views Llc
Current Estimated Value
Home Financials for this Owner
Home Financials are based on the most recent Mortgage that was taken out on this home.
Original Mortgage
$131,693
Outstanding Balance
$127,516
Interest Rate
6.27%
Mortgage Type
Purchase Money Mortgage
Estimated Equity
$62,449
Purchase Details
Closed on
Sep 3, 2020
Sold by
Majewski Taylor and Majewski Laura
Bought by
Mazzella Michael and Mazzella Kayla
Purchase Details
Closed on
Feb 23, 2005
Sold by
Hums Preston
Bought by
Hums Preston W
Create a Home Valuation Report for This Property
The Home Valuation Report is an in-depth analysis detailing your home's value as well as a comparison with similar homes in the area
Home Values in the Area
Average Home Value in this Area
Purchase History
| Date | Buyer | Sale Price | Title Company |
|---|---|---|---|
| Perfect Views Llc | $70,000 | None Available | |
| Mazzella Michael | $365,000 | None Available | |
| Hums Preston W | -- | & Rich, Llp Blustein, Shapir |
Source: Public Records
Mortgage History
| Date | Status | Borrower | Loan Amount |
|---|---|---|---|
| Open | Perfect Views Llc | $131,693 |
Source: Public Records
Tax History Compared to Growth
Tax History
| Year | Tax Paid | Tax Assessment Tax Assessment Total Assessment is a certain percentage of the fair market value that is determined by local assessors to be the total taxable value of land and additions on the property. | Land | Improvement |
|---|---|---|---|---|
| 2024 | $2,513 | $35,000 | $4,000 | $31,000 |
| 2023 | $2,513 | $35,000 | $4,000 | $31,000 |
| 2022 | $3,211 | $35,000 | $4,000 | $31,000 |
| 2021 | $2,779 | $35,000 | $4,000 | $31,000 |
| 2020 | $2,850 | $35,000 | $4,000 | $31,000 |
| 2019 | $348 | $35,000 | $4,000 | $31,000 |
| 2018 | $3,499 | $35,000 | $4,000 | $31,000 |
| 2017 | $2,753 | $35,000 | $4,000 | $31,000 |
| 2016 | $3,574 | $35,000 | $4,000 | $31,000 |
| 2015 | -- | $35,000 | $4,000 | $31,000 |
| 2014 | -- | $35,000 | $4,000 | $31,000 |
Source: Public Records
Map
Nearby Homes
- 172 Front St Unit 172
- 165 Front St
- 142 Ball St
- 189 E Main St
- 120 Jersey Ave
- 109 US Highway 6
- 138 Front St Unit 140
- 131 Front St
- 115 Hammond St
- 178-180 Ball St
- 122 Front St
- 1 High St
- 39 Church St Unit 3
- 39 Church St Unit 22
- 39 Church St Unit 53
- 39 Church St Unit 4
- 92 Front St
- 9 Carpenter Rd
- 9 Neversink Dr
- 11 Neversink Dr