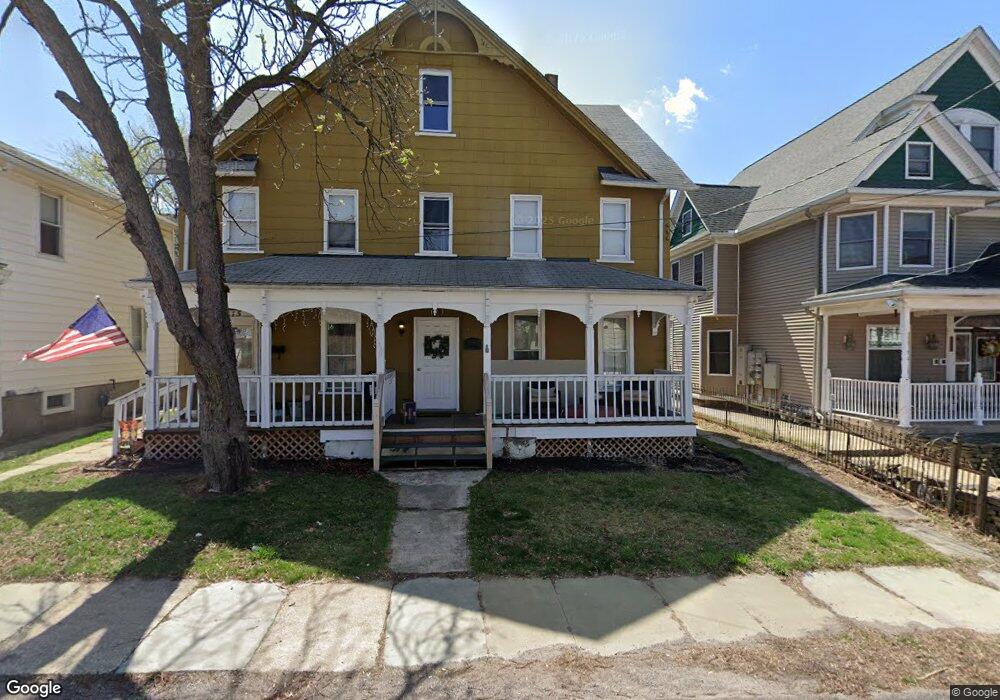
173 Broad St Pittston, PA 18640
Estimated Value: $139,032 - $200,000
--
Bed
--
Bath
2,608
Sq Ft
$69/Sq Ft
Est. Value
About This Home
This home is located at 173 Broad St, Pittston, PA 18640 and is currently estimated at $181,008, approximately $69 per square foot. 173 Broad St is a home located in Luzerne County with nearby schools including Pittston City Intermediate Center, Pittston Area Middle School, and Pittston Area Senior High School.
Ownership History
Date
Name
Owned For
Owner Type
Purchase Details
Closed on
Dec 15, 2017
Sold by
Lussi Arthur J and Lussi Ronald F
Bought by
Ameen John and Bast Victoria
Current Estimated Value
Home Financials for this Owner
Home Financials are based on the most recent Mortgage that was taken out on this home.
Original Mortgage
$72,168
Outstanding Balance
$61,616
Interest Rate
4.5%
Mortgage Type
FHA
Estimated Equity
$119,392
Purchase Details
Closed on
Aug 31, 2007
Sold by
Lussi Carol
Bought by
Lussi Arthur J and Lussi Ronald F
Create a Home Valuation Report for This Property
The Home Valuation Report is an in-depth analysis detailing your home's value as well as a comparison with similar homes in the area
Home Values in the Area
Average Home Value in this Area
Purchase History
| Date | Buyer | Sale Price | Title Company |
|---|---|---|---|
| Ameen John | $73,500 | United One Resources Inc | |
| Lussi Arthur J | -- | None Available |
Source: Public Records
Mortgage History
| Date | Status | Borrower | Loan Amount |
|---|---|---|---|
| Open | Ameen John | $72,168 |
Source: Public Records
Tax History Compared to Growth
Tax History
| Year | Tax Paid | Tax Assessment Tax Assessment Total Assessment is a certain percentage of the fair market value that is determined by local assessors to be the total taxable value of land and additions on the property. | Land | Improvement |
|---|---|---|---|---|
| 2025 | $2,100 | $70,600 | $19,500 | $51,100 |
| 2024 | $2,100 | $70,600 | $19,500 | $51,100 |
| 2023 | $2,100 | $70,600 | $19,500 | $51,100 |
| 2022 | $2,087 | $70,600 | $19,500 | $51,100 |
| 2021 | $2,087 | $70,600 | $19,500 | $51,100 |
| 2020 | $2,048 | $70,600 | $19,500 | $51,100 |
| 2019 | $2,034 | $70,600 | $19,500 | $51,100 |
| 2018 | $1,999 | $70,600 | $19,500 | $51,100 |
| 2017 | $1,963 | $70,600 | $19,500 | $51,100 |
| 2016 | -- | $70,600 | $19,500 | $51,100 |
| 2015 | $1,138 | $70,600 | $19,500 | $51,100 |
| 2014 | $1,138 | $70,600 | $19,500 | $51,100 |
Source: Public Records
Map
Nearby Homes