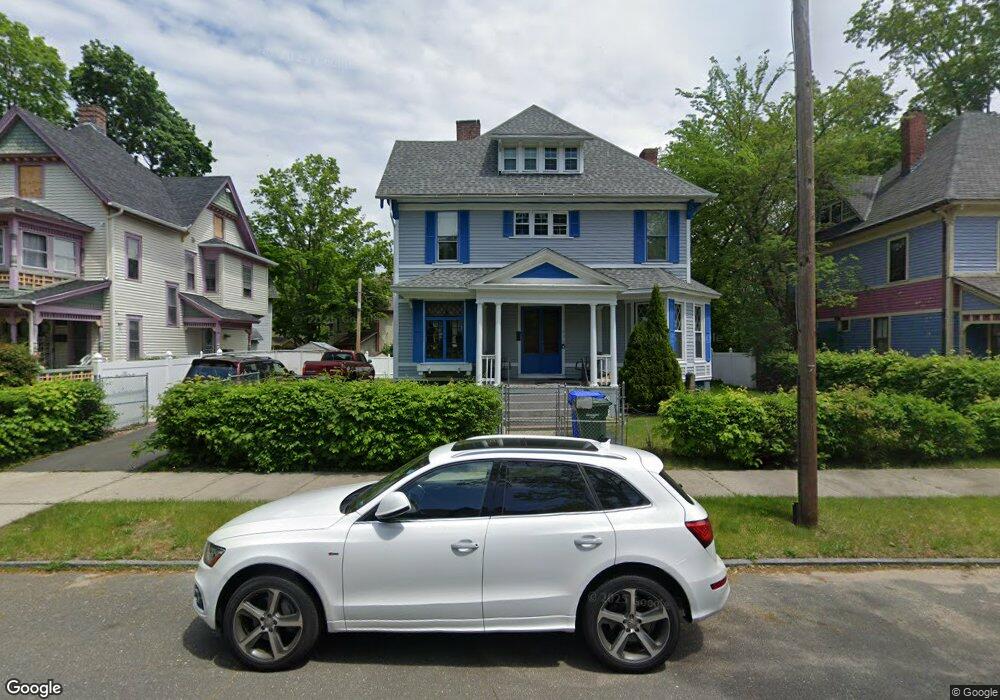
173 Buckingham St Springfield, MA 01109
McKnight NeighborhoodEstimated Value: $242,000 - $285,552
6
Beds
3
Baths
3,238
Sq Ft
$83/Sq Ft
Est. Value
About This Home
This home is located at 173 Buckingham St, Springfield, MA 01109 and is currently estimated at $268,138, approximately $82 per square foot. 173 Buckingham St is a home located in Hampden County with nearby schools including Rebecca M Johnson School, Van Sickle Academy, and High School Of Commerce.
Ownership History
Date
Name
Owned For
Owner Type
Purchase Details
Closed on
Dec 29, 2006
Sold by
Wells Fargo Bk Na
Bought by
Clarke Georgia
Current Estimated Value
Home Financials for this Owner
Home Financials are based on the most recent Mortgage that was taken out on this home.
Original Mortgage
$74,100
Outstanding Balance
$44,479
Interest Rate
6.29%
Mortgage Type
Purchase Money Mortgage
Estimated Equity
$223,659
Purchase Details
Closed on
Dec 28, 2006
Sold by
Davila Edwin
Bought by
Wells Fargo Bk Na
Home Financials for this Owner
Home Financials are based on the most recent Mortgage that was taken out on this home.
Original Mortgage
$74,100
Outstanding Balance
$44,479
Interest Rate
6.29%
Mortgage Type
Purchase Money Mortgage
Estimated Equity
$223,659
Purchase Details
Closed on
Nov 20, 1998
Sold by
Oliver Julia
Bought by
Davila Edwin
Home Financials for this Owner
Home Financials are based on the most recent Mortgage that was taken out on this home.
Original Mortgage
$89,010
Interest Rate
6.49%
Mortgage Type
Purchase Money Mortgage
Create a Home Valuation Report for This Property
The Home Valuation Report is an in-depth analysis detailing your home's value as well as a comparison with similar homes in the area
Home Values in the Area
Average Home Value in this Area
Purchase History
| Date | Buyer | Sale Price | Title Company |
|---|---|---|---|
| Clarke Georgia | $78,000 | -- | |
| Wells Fargo Bk Na | $126,813 | -- | |
| Davila Edwin | $101,900 | -- |
Source: Public Records
Mortgage History
| Date | Status | Borrower | Loan Amount |
|---|---|---|---|
| Open | Clarke Georgia | $74,100 | |
| Previous Owner | Davila Edwin | $89,010 | |
| Previous Owner | Davila Edwin | $55,000 | |
| Previous Owner | Davila Edwin | $48,500 | |
| Closed | Davila Edwin | $4,945 |
Source: Public Records
Tax History
| Year | Tax Paid | Tax Assessment Tax Assessment Total Assessment is a certain percentage of the fair market value that is determined by local assessors to be the total taxable value of land and additions on the property. | Land | Improvement |
|---|---|---|---|---|
| 2025 | $2,913 | $185,800 | $25,900 | $159,900 |
| 2024 | $2,746 | $171,000 | $24,200 | $146,800 |
| 2023 | $2,685 | $157,500 | $23,000 | $134,500 |
| 2022 | $2,528 | $134,300 | $20,900 | $113,400 |
| 2021 | $2,504 | $132,500 | $19,000 | $113,500 |
| 2020 | $2,279 | $116,700 | $19,000 | $97,700 |
| 2019 | $2,220 | $112,800 | $16,200 | $96,600 |
| 2018 | $2,297 | $116,700 | $16,200 | $100,500 |
| 2017 | $2,379 | $121,000 | $15,300 | $105,700 |
| 2016 | $2,263 | $115,100 | $15,300 | $99,800 |
| 2015 | $2,274 | $115,600 | $15,300 | $100,300 |
Source: Public Records
Map
Nearby Homes
- 107 Dartmouth St
- 158 Bowles St
- 16 Amherst St
- 41 Florida St
- 123 Bay St
- 163 Marion St
- 22-24 Westminster St
- 63 Bay St
- LOT 3 N S Worthington St
- 393 Saint James Ave
- 106 Amherst St
- 21 Clifford St
- 52-56 Andrew St
- 148 Yale St
- 16 Cambridge St
- 145 Cambridge St
- 138 Magazine St
- 65 Montrose St
- 46 Mapledell St
- 118 Quincy St
- 181 Buckingham St
- 165 Buckingham St
- 48 Clarendon St
- 52 Clarendon St
- 38 Clarendon St Unit 40
- 38-40 Clarendon St
- 0 Buckingham St (Ws)
- 29 Buckingham Place
- 62 Clarendon St
- 36 Clarendon St
- 21 Buckingham Place
- 174 Buckingham St
- 170 Buckingham St Unit 172
- 170-172 Buckingham St
- 32 Clarendon St Unit 34
- 32-34 Clarendon St Unit 32
- 32-34 Clarendon St
- 186 Buckingham St
- 166 Buckingham St
- 190 Buckingham St
Your Personal Tour Guide
Ask me questions while you tour the home.