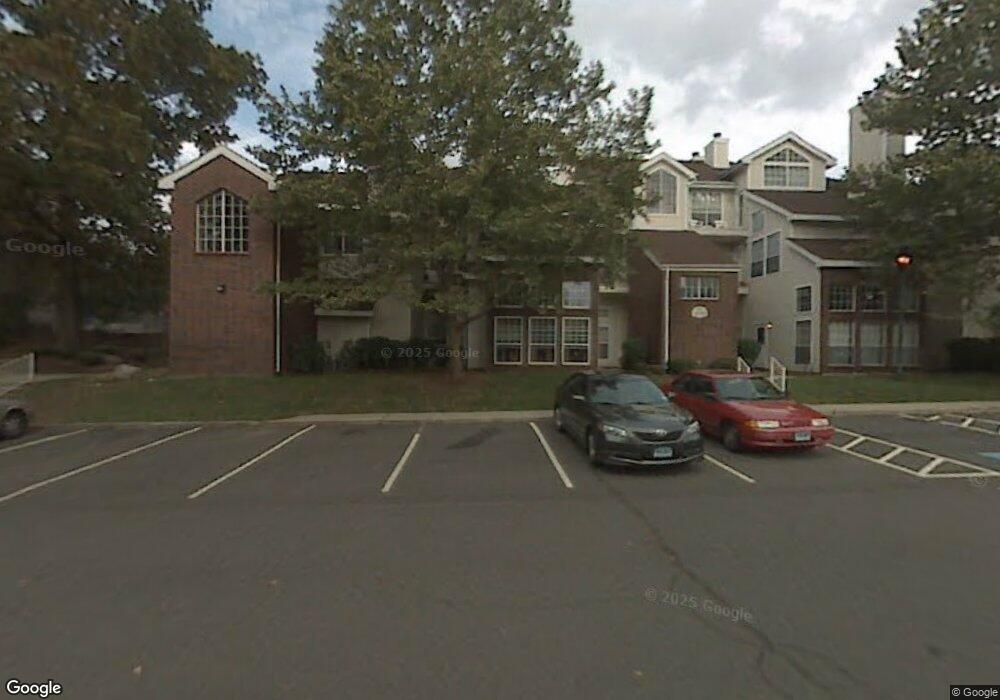
173 Carriage Crossing Ln Middletown, CT 06457
Westfield NeighborhoodEstimated Value: $235,000 - $254,000
2
Beds
2
Baths
950
Sq Ft
$255/Sq Ft
Est. Value
About This Home
This home is located at 173 Carriage Crossing Ln, Middletown, CT 06457 and is currently estimated at $242,161, approximately $254 per square foot. 173 Carriage Crossing Ln is a home located in Middlesex County with nearby schools including Moody School.
Ownership History
Date
Name
Owned For
Owner Type
Purchase Details
Closed on
Oct 11, 2024
Sold by
Hurler Brian T
Bought by
Mankoski Heather
Current Estimated Value
Home Financials for this Owner
Home Financials are based on the most recent Mortgage that was taken out on this home.
Original Mortgage
$218,500
Outstanding Balance
$215,987
Interest Rate
6.35%
Mortgage Type
Purchase Money Mortgage
Estimated Equity
$26,174
Purchase Details
Closed on
Jan 6, 2003
Sold by
Herbin Jennifer M
Bought by
Hurler Brian T
Home Financials for this Owner
Home Financials are based on the most recent Mortgage that was taken out on this home.
Original Mortgage
$85,200
Interest Rate
6.08%
Purchase Details
Closed on
Mar 2, 2001
Sold by
Lane Gordan S
Bought by
Hubbard Jennifer M
Home Financials for this Owner
Home Financials are based on the most recent Mortgage that was taken out on this home.
Original Mortgage
$76,000
Interest Rate
7%
Create a Home Valuation Report for This Property
The Home Valuation Report is an in-depth analysis detailing your home's value as well as a comparison with similar homes in the area
Home Values in the Area
Average Home Value in this Area
Purchase History
| Date | Buyer | Sale Price | Title Company |
|---|---|---|---|
| Mankoski Heather | $232,000 | None Available | |
| Mankoski Heather | $232,000 | None Available | |
| Hurler Brian T | $106,500 | -- | |
| Hurler Brian T | $106,500 | -- | |
| Hubbard Jennifer M | $79,000 | -- | |
| Hubbard Jennifer M | $79,000 | -- |
Source: Public Records
Mortgage History
| Date | Status | Borrower | Loan Amount |
|---|---|---|---|
| Open | Mankoski Heather | $218,500 | |
| Closed | Mankoski Heather | $218,500 | |
| Previous Owner | Hubbard Jennifer M | $175,000 | |
| Previous Owner | Hubbard Jennifer M | $85,200 | |
| Previous Owner | Hubbard Jennifer M | $76,000 |
Source: Public Records
Tax History Compared to Growth
Tax History
| Year | Tax Paid | Tax Assessment Tax Assessment Total Assessment is a certain percentage of the fair market value that is determined by local assessors to be the total taxable value of land and additions on the property. | Land | Improvement |
|---|---|---|---|---|
| 2025 | $3,654 | $108,460 | $0 | $108,460 |
| 2024 | $3,464 | $108,460 | $0 | $108,460 |
| 2023 | $3,259 | $108,460 | $0 | $108,460 |
| 2022 | $3,036 | $80,930 | $0 | $80,930 |
| 2021 | $3,029 | $80,930 | $0 | $80,930 |
| 2020 | $3,033 | $80,930 | $0 | $80,930 |
| 2019 | $3,050 | $80,930 | $0 | $80,930 |
| 2018 | $2,941 | $80,930 | $0 | $80,930 |
| 2017 | $3,112 | $87,790 | $0 | $87,790 |
| 2016 | $3,052 | $87,790 | $0 | $87,790 |
| 2015 | $2,986 | $87,790 | $0 | $87,790 |
| 2014 | $2,987 | $87,790 | $0 | $87,790 |
Source: Public Records
Map
Nearby Homes
- 130 Carriage Crossing Ln Unit 130
- 48 Carriage Crossing Ln Unit 8108
- 7 W Meadow Ln Unit 5
- 67 Braeburn Ln
- 7 Inverness Square
- 59 Inverness Ln
- 59 Fieldbrook Rd
- 886 East St
- 14 Rising Trail Dr
- 52 Rising Trail Dr
- 36 Rising Trail Dr Unit 36
- 100 Rising Trail Dr Unit 100
- 162 Rising Trail Dr
- 17 Flynn Ln
- 123 Burgundy Hill Ln
- 36 Burgundy Hill Ln
- 48 Burgundy Hill Ln Unit 48
- 56 Burgundy Hill Ln Unit 56
- 38 Burgundy Hill Ln
- 229 Burgundy Hill Ln Unit 229
- 173 Carriage Crossing Ln Unit 173
- 172 Carriage Crossing Ln Unit 17
- 172 Carriage Crossing Ln
- 172 Carriage Crossing Ln Unit 172
- 174 Carriage Crossing Ln
- 175 Carriage Crossing Ln
- 175 Carriage Crossing Ln
- 171 Carriage Crossing Ln
- 171 Carriage Crossing Ln Unit 171
- 176 Carriage Crossing Ln
- 170 Carriage Crossing Ln
- 170 Carriage Crossing Ln Unit 170
- 177 Carriage Crossing Ln
- 177 Carriage Crossing Ln Unit 177
- 169 Carriage Crossing Ln
- 178 Carriage Crossing Ln
- 178 Carriage Crossing Ln Unit 178
- 168 Carriage Crossing Ln
- 179 Carriage Crossing Ln
- 167 Carriage Crossing Ln