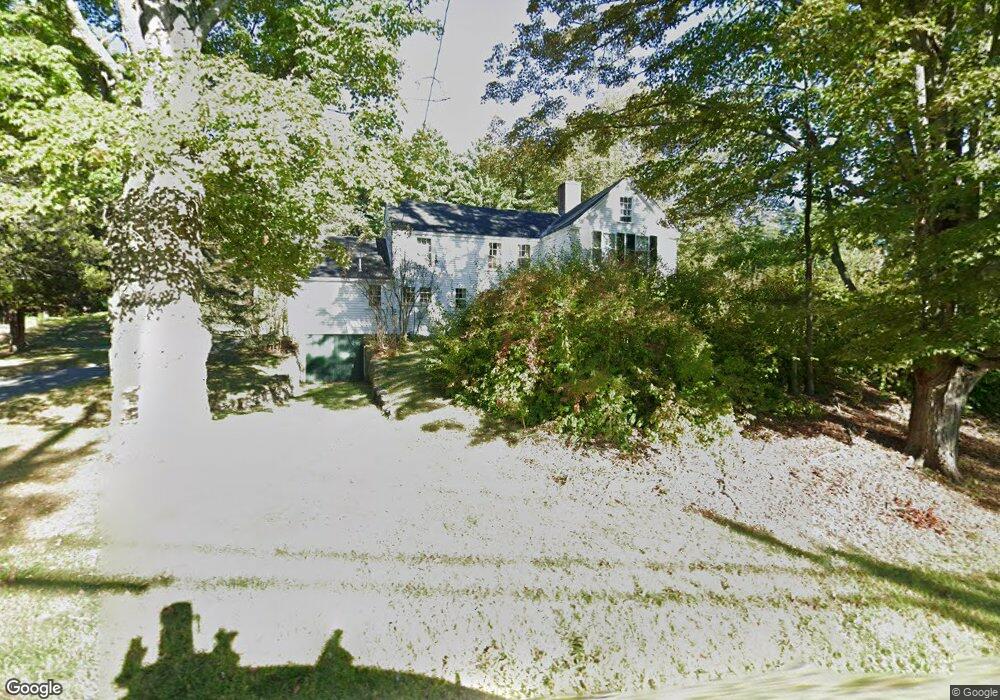
173 Center Rd Shirley, MA 01464
Estimated Value: $670,015 - $703,000
4
Beds
3
Baths
2,520
Sq Ft
$272/Sq Ft
Est. Value
About This Home
This home is located at 173 Center Rd, Shirley, MA 01464 and is currently estimated at $684,504, approximately $271 per square foot. 173 Center Rd is a home located in Middlesex County with nearby schools including Page Hilltop School, Lura A. White Elementary School, and Ayer Shirley Regional Middle School.
Ownership History
Date
Name
Owned For
Owner Type
Purchase Details
Closed on
Oct 23, 1992
Sold by
Prufer Claus M
Bought by
Przybyla Paul T
Current Estimated Value
Home Financials for this Owner
Home Financials are based on the most recent Mortgage that was taken out on this home.
Original Mortgage
$90,000
Interest Rate
7.79%
Mortgage Type
Purchase Money Mortgage
Create a Home Valuation Report for This Property
The Home Valuation Report is an in-depth analysis detailing your home's value as well as a comparison with similar homes in the area
Home Values in the Area
Average Home Value in this Area
Purchase History
| Date | Buyer | Sale Price | Title Company |
|---|---|---|---|
| Przybyla Paul T | $215,000 | -- |
Source: Public Records
Mortgage History
| Date | Status | Borrower | Loan Amount |
|---|---|---|---|
| Open | Przybyla Paul T | $20,000 | |
| Open | Przybyla Paul T | $40,000 | |
| Closed | Przybyla Paul T | $89,500 | |
| Closed | Przybyla Paul T | $90,000 |
Source: Public Records
Tax History Compared to Growth
Tax History
| Year | Tax Paid | Tax Assessment Tax Assessment Total Assessment is a certain percentage of the fair market value that is determined by local assessors to be the total taxable value of land and additions on the property. | Land | Improvement |
|---|---|---|---|---|
| 2025 | $75 | $577,700 | $168,600 | $409,100 |
| 2024 | $7,164 | $527,900 | $153,800 | $374,100 |
| 2023 | $6,823 | $481,200 | $153,800 | $327,400 |
| 2022 | $6,447 | $416,500 | $149,800 | $266,700 |
| 2021 | $6,369 | $385,300 | $137,800 | $247,500 |
| 2020 | $6,094 | $378,300 | $137,800 | $240,500 |
| 2019 | $5,943 | $369,600 | $137,800 | $231,800 |
| 2018 | $5,775 | $351,700 | $133,000 | $218,700 |
| 2017 | $5,602 | $339,100 | $129,800 | $209,300 |
| 2016 | $5,767 | $349,300 | $129,800 | $219,500 |
| 2015 | $6,019 | $347,700 | $128,200 | $219,500 |
Source: Public Records
Map
Nearby Homes
- 49 Parker Rd
- 3 Ambrose Way Unit 3
- 6 Ambrose Way Unit 3
- 9 Ambrose Way Unit 9
- 1 Ambrose Way Unit 1
- 7 Ambrose Way Unit 5
- 4 Ambrose Way Unit 4
- 5 Ambrose Way Unit 5
- 13 Ambrose Way Unit 13
- 601 Flat Hill Rd
- 83 Clark Rd Unit 41
- 124 Hazen Rd
- 22 Townsend Rd
- 45 Clark Rd
- 30 Ayer Rd
- 43 Longley Rd
- 40 Ayer Rd
- 25 Front St
- 3 Mill St
- 45 Spring St