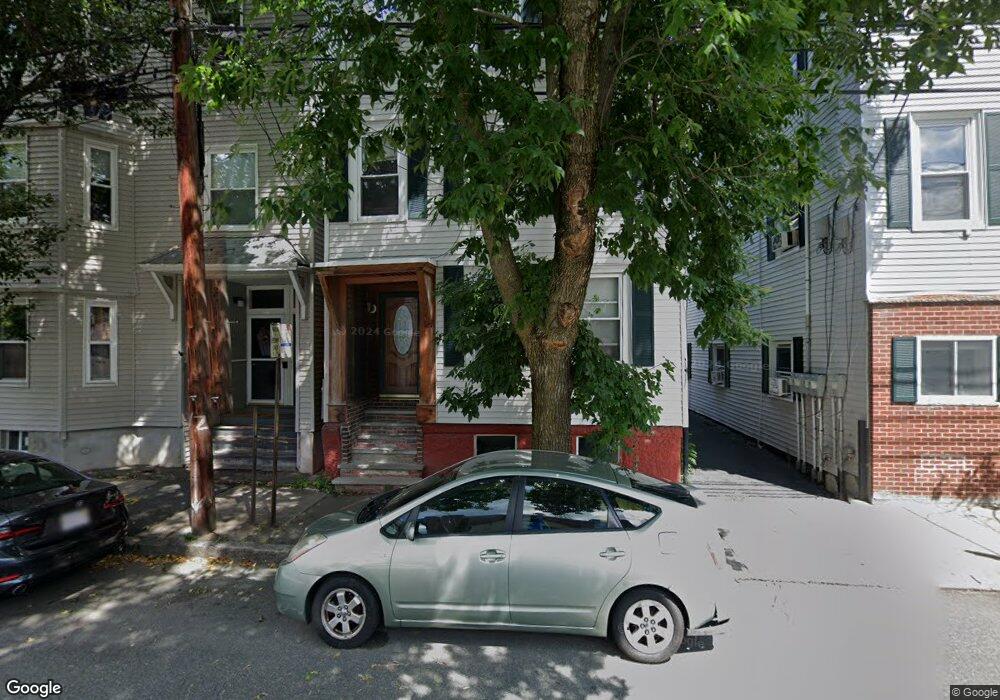
173 Charles St Cambridge, MA 02141
East Cambridge NeighborhoodEstimated Value: $1,201,000 - $1,476,075
3
Beds
3
Baths
1,483
Sq Ft
$911/Sq Ft
Est. Value
About This Home
This home is located at 173 Charles St, Cambridge, MA 02141 and is currently estimated at $1,351,519, approximately $911 per square foot. 173 Charles St is a home located in Middlesex County with nearby schools including Prospect Hill Academy Charter School and Community Charter School of Cambridge.
Ownership History
Date
Name
Owned For
Owner Type
Purchase Details
Closed on
Sep 19, 2012
Sold by
J & G Rt
Bought by
173 Charles Street Llc
Current Estimated Value
Home Financials for this Owner
Home Financials are based on the most recent Mortgage that was taken out on this home.
Original Mortgage
$700,000
Outstanding Balance
$484,828
Interest Rate
3.59%
Mortgage Type
Purchase Money Mortgage
Estimated Equity
$866,691
Create a Home Valuation Report for This Property
The Home Valuation Report is an in-depth analysis detailing your home's value as well as a comparison with similar homes in the area
Home Values in the Area
Average Home Value in this Area
Purchase History
| Date | Buyer | Sale Price | Title Company |
|---|---|---|---|
| 173 Charles Street Llc | $1,150,000 | -- |
Source: Public Records
Mortgage History
| Date | Status | Borrower | Loan Amount |
|---|---|---|---|
| Open | 173 Charles Street Llc | $700,000 |
Source: Public Records
Tax History
| Year | Tax Paid | Tax Assessment Tax Assessment Total Assessment is a certain percentage of the fair market value that is determined by local assessors to be the total taxable value of land and additions on the property. | Land | Improvement |
|---|---|---|---|---|
| 2025 | $6,847 | $1,078,300 | $692,900 | $385,400 |
| 2024 | $6,526 | $1,102,300 | $731,200 | $371,100 |
| 2023 | $5,999 | $1,023,700 | $698,100 | $325,600 |
| 2022 | $5,629 | $986,400 | $692,200 | $294,200 |
| 2021 | $6,257 | $962,300 | $679,200 | $283,100 |
| 2020 | $11,223 | $963,500 | $685,600 | $277,900 |
| 2019 | $5,928 | $927,700 | $672,500 | $255,200 |
| 2018 | $7,224 | $794,500 | $557,700 | $236,800 |
| 2017 | $4,693 | $723,100 | $498,600 | $224,500 |
| 2016 | $4,190 | $599,400 | $390,400 | $209,000 |
| 2015 | $4,070 | $520,400 | $334,600 | $185,800 |
| 2014 | $3,567 | $425,700 | $259,200 | $166,500 |
Source: Public Records
Map
Nearby Homes
- 241 Hurley St Unit 1
- 259 Hurley St Unit 4
- 303 Hurley St
- 76-78 Thorndike St
- 50 Spring St
- 78 Otis St
- 93 Third St
- 68 Gore St
- 30 2nd St Unit B
- 30 2nd St Unit A
- 30
- 59 7th St
- 59 7th St Unit 2
- 59 7th St Unit 1
- 59 7th St Unit 3
- 47-53R 8th St
- 10 Rogers St Unit 606
- 10 Rogers St Unit 211
- 10 Rogers St Unit 703
- 10 Rogers St Unit PH4
- 173 Charles St Unit 2
- 177 Charles St
- 177 Charles St Unit 1
- 167 Charles St
- 175 Charles St Unit 3
- 175 Charles St
- 169 Charles St
- 165 Charles St
- 165 Charles St Unit 2
- 163 Charles St
- 163 Charles St Unit 1
- 181 Charles St
- 181 Charles St Unit 1
- 179 Charles St Unit 3
- 155 Charles St
- 185 Charles St
- 157 Charles St Unit 2
- 256 Hurley St Unit 1
- 256 Hurley St Unit uni1F 3-bed 1 bath
- 256 Hurley St
Your Personal Tour Guide
Ask me questions while you tour the home.