173 Chestnut St Everett, MA 02149
Glendale NeighborhoodEstimated Value: $834,300 - $988,000
About This Home
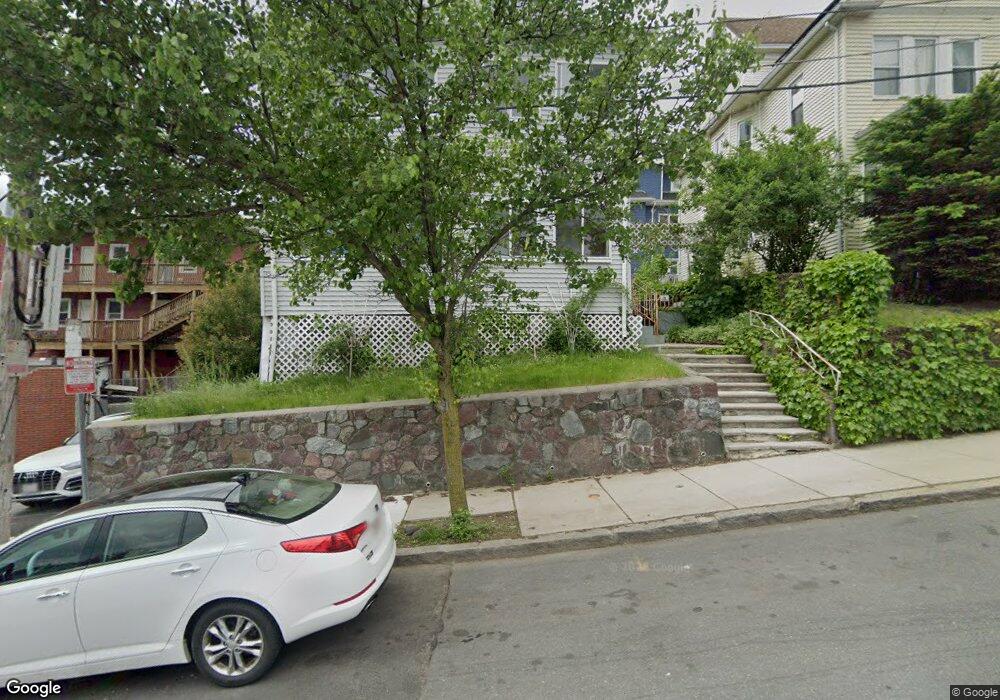
This home is located at 173 Chestnut St, Everett, MA 02149 and is currently estimated at $912,075, approximately $379 per square foot. 173 Chestnut St is a home located in Middlesex County with nearby schools including Everett High School, Phoenix Charter Academy - Chelsea, and Malden Catholic.
Ownership History
We collect this data history from publicly available records. To have your information removed, we recommend requesting removal directly through your county’s website.
Purchase Details
Home Values in the Area
Average Home Value in this Area
Purchase History
We collect this data history from publicly available records. To have your information removed, we recommend requesting removal directly through your county’s website.
| Date | Buyer | Sale Price | Title Company |
|---|---|---|---|
| $126,700 | -- |
Mortgage History
We collect this data history from publicly available records. To have your information removed, we recommend requesting removal directly through your county’s website.
| Date | Status | Borrower | Loan Amount |
|---|---|---|---|
| Open | $160,000 | ||
| Closed | $110,000 | ||
| Closed | $65,000 | ||
| Closed | $30,000 | ||
| Closed | $245,000 | ||
| Closed | $101,000 | ||
| Closed | $40,000 |
Tax History
We collect this data history from publicly available records. To have your information removed, we recommend requesting removal directly through your county’s website.
| Year | Tax Paid | Tax Assessment Tax Assessment Total Assessment is a certain percentage of the fair market value that is determined by local assessors to be the total taxable value of land and additions on the property. | Land | Improvement |
|---|---|---|---|---|
| 2025 | $8,765 | $769,500 | $249,300 | $520,200 |
| 2024 | $8,024 | $700,200 | $221,600 | $478,600 |
| 2023 | $7,719 | $655,300 | $203,100 | $452,200 |
| 2022 | $6,337 | $611,700 | $193,900 | $417,800 |
| 2021 | $5,676 | $575,100 | $173,600 | $401,500 |
| 2020 | $5,969 | $561,000 | $173,600 | $387,400 |
| 2019 | $6,309 | $509,600 | $165,300 | $344,300 |
| 2018 | $6,171 | $447,800 | $144,000 | $303,800 |
| 2017 | $5,613 | $388,700 | $110,800 | $277,900 |
| 2016 | $5,188 | $359,000 | $110,800 | $248,200 |
| 2015 | $4,905 | $335,700 | $104,100 | $231,600 |
Map
- 110 Ferry St
- 43-45 Shirley St
- 33 Nichols St
- 20 Derne St
- 80 Clarence St
- 6 Hillside Ave
- 148 Florence St
- 29 Oakland Ave
- 32 Fremont Ave
- 4 High Street Terrace Unit 2
- 6 Hampshire St
- 20 Raymond St
- 40 Baker Rd
- 58 Union St
- 30 Rosedale Ave
- 8 Parker St Unit 5
- 29 Harvey St
- 14 Harding Ave
- 2 Rosedale Ave
- 94-96 Francis St
- 3 Magnolia Ct Unit 2
- 3 Magnolia Ct
- 5 Magnolia Ct
- 1 Magnolia Ct
- 171 Chestnut St
- 169 Chestnut St
- 2 Magnolia Ct
- 4 Magnolia Ct
- 25 Pleasant View Ave
- 29 Pleasant View Ave
- 23 Pleasant View Ave
- 31 Pleasant View Ave
- 153 Chestnut St
- 19 Pleasant View Ave
- 33 Pleasant View Ave
- 164 Chestnut St
- 168 Chestnut St
- 162 Chestnut St
- 17 Pleasant View Ave
- 37 Pleasant View Ave
Ask me questions while you tour the home.