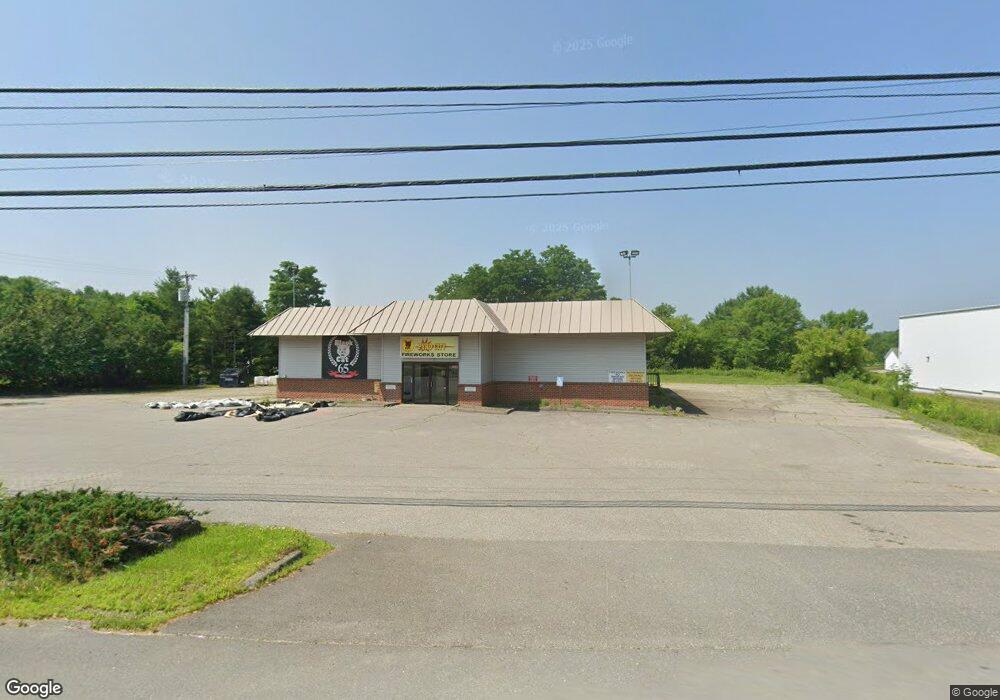
173 China Rd Winslow, ME 04901
--
Bed
--
Bath
5,697
Sq Ft
1.59
Acres
About This Home
This home is located at 173 China Rd, Winslow, ME 04901. 173 China Rd is a home located in Kennebec County with nearby schools including Winslow Elementary School, Winslow Junior High School, and Winslow High School.
Ownership History
Date
Name
Owned For
Owner Type
Purchase Details
Closed on
Nov 1, 2019
Sold by
Martin & Ware Inc
Bought by
Shm Realty Llc
Purchase Details
Closed on
Mar 26, 2012
Sold by
Dionne Kenneth C and Dionne Martha A
Bought by
Martin & Ware Inc
Purchase Details
Closed on
Dec 22, 2008
Sold by
Skowhegan Savings Bank
Bought by
Dionne Martha
Create a Home Valuation Report for This Property
The Home Valuation Report is an in-depth analysis detailing your home's value as well as a comparison with similar homes in the area
Home Values in the Area
Average Home Value in this Area
Purchase History
| Date | Buyer | Sale Price | Title Company |
|---|---|---|---|
| Shm Realty Llc | -- | -- | |
| Martin & Ware Inc | $285,000 | -- | |
| Dionne Martha | -- | -- |
Source: Public Records
Tax History Compared to Growth
Tax History
| Year | Tax Paid | Tax Assessment Tax Assessment Total Assessment is a certain percentage of the fair market value that is determined by local assessors to be the total taxable value of land and additions on the property. | Land | Improvement |
|---|---|---|---|---|
| 2024 | $8,094 | $539,600 | $195,400 | $344,200 |
| 2023 | $7,334 | $488,900 | $195,400 | $293,500 |
| 2022 | $7,291 | $343,900 | $62,600 | $281,300 |
| 2021 | $7,074 | $350,200 | $62,600 | $287,600 |
| 2020 | $6,591 | $350,200 | $62,600 | $287,600 |
| 2019 | $6,528 | $350,200 | $62,600 | $287,600 |
| 2018 | $6,283 | $350,200 | $62,600 | $287,600 |
| 2017 | $5,862 | $350,200 | $62,600 | $287,600 |
| 2016 | $5,512 | $350,200 | $62,600 | $287,600 |
| 2015 | $5,437 | $350,800 | $63,200 | $287,600 |
| 2014 | $5,437 | $350,800 | $63,200 | $287,600 |
Source: Public Records
Map
Nearby Homes