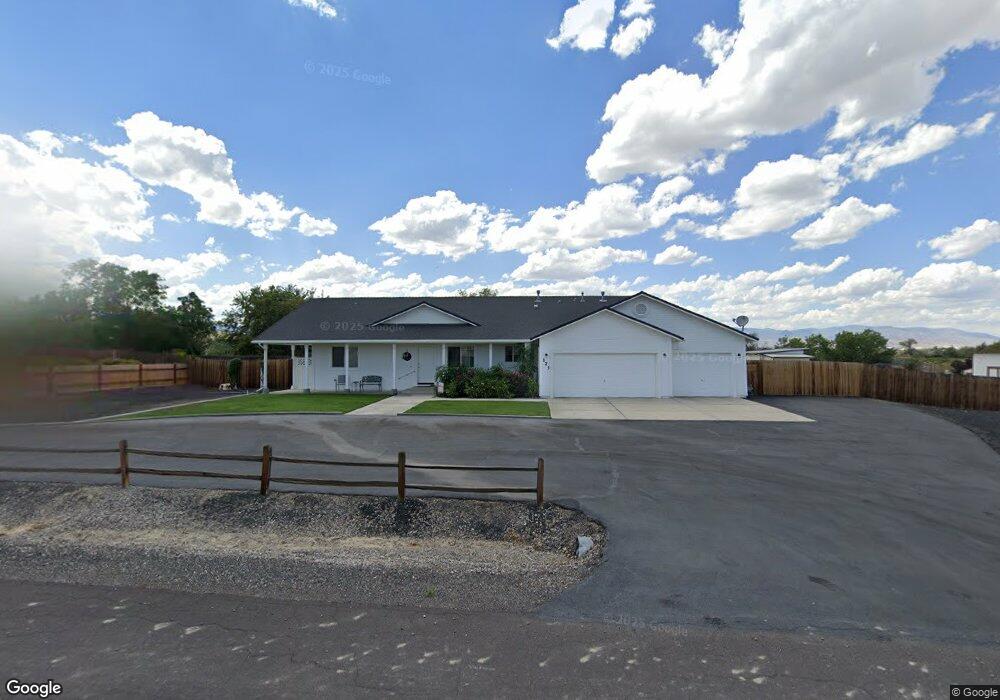
173 Country Ranch Rd Fernley, NV 89408
Estimated Value: $549,000 - $632,000
5
Beds
4
Baths
3,230
Sq Ft
$183/Sq Ft
Est. Value
About This Home
This home is located at 173 Country Ranch Rd, Fernley, NV 89408 and is currently estimated at $591,919, approximately $183 per square foot. 173 Country Ranch Rd is a home located in Lyon County with nearby schools including East Valley Elementary School, Fernley Intermediate School, and Fernley High School.
Ownership History
Date
Name
Owned For
Owner Type
Purchase Details
Closed on
Oct 29, 2024
Sold by
Flores June M
Bought by
2024 June Maxine Flores Revocable Living Trus and Flores
Current Estimated Value
Purchase Details
Closed on
Sep 23, 2009
Sold by
Obrien Steve L and Obrien Lori E
Bought by
Flores Frank and Flores June M
Purchase Details
Closed on
Sep 4, 2009
Sold by
Trethewy Tari L and Greenwood Charlotte V
Bought by
Obrien Steven L and Obrien Lori E
Purchase Details
Closed on
Jul 17, 2006
Sold by
Trethewy Tari L and Greenwood Charlotte V
Bought by
Trethewy Tari L
Purchase Details
Closed on
Feb 10, 2006
Sold by
Fogliani Timothy K and Mcgovern Patricia L
Bought by
Trethewy Tari L and Greenwood Charlotte
Home Financials for this Owner
Home Financials are based on the most recent Mortgage that was taken out on this home.
Original Mortgage
$360,000
Interest Rate
6.2%
Mortgage Type
Purchase Money Mortgage
Create a Home Valuation Report for This Property
The Home Valuation Report is an in-depth analysis detailing your home's value as well as a comparison with similar homes in the area
Home Values in the Area
Average Home Value in this Area
Purchase History
| Date | Buyer | Sale Price | Title Company |
|---|---|---|---|
| 2024 June Maxine Flores Revocable Living Trus | -- | None Listed On Document | |
| Flores Frank | $184,000 | Western Title Yerington | |
| Obrien Steven L | $135,725 | Fidelity Natl Title Ins Co | |
| Trethewy Tari L | $450,000 | None Available | |
| Trethewy Tari L | $450,000 | First American Title Co Nv |
Source: Public Records
Mortgage History
| Date | Status | Borrower | Loan Amount |
|---|---|---|---|
| Previous Owner | Trethewy Tari L | $360,000 |
Source: Public Records
Tax History Compared to Growth
Tax History
| Year | Tax Paid | Tax Assessment Tax Assessment Total Assessment is a certain percentage of the fair market value that is determined by local assessors to be the total taxable value of land and additions on the property. | Land | Improvement |
|---|---|---|---|---|
| 2025 | $3,172 | $177,647 | $63,000 | $114,647 |
| 2024 | $3,488 | $178,284 | $63,000 | $115,284 |
| 2023 | $3,488 | $170,879 | $63,000 | $107,879 |
| 2022 | $3,261 | $157,424 | $63,000 | $94,424 |
| 2021 | $3,203 | $148,383 | $56,000 | $92,383 |
| 2020 | $3,117 | $149,055 | $56,000 | $93,055 |
| 2019 | $3,054 | $145,680 | $56,000 | $89,680 |
| 2018 | $2,981 | $129,527 | $42,000 | $87,527 |
| 2017 | $2,939 | $122,485 | $35,000 | $87,485 |
| 2016 | $2,719 | $74,255 | $11,550 | $62,705 |
| 2015 | $2,752 | $73,581 | $11,550 | $62,031 |
| 2014 | $2,683 | $73,925 | $11,550 | $62,375 |
Source: Public Records
Map
Nearby Homes
- 6778 Shell Ct
- 3457 Payton Way
- 3466 Payton Way
- 3462 Payton Way Unit Lot 98
- 3299 Hadley St Unit Lot 62
- 3274 Eleanor Way
- 2976 N Fork Rd
- 7785 Desert Shadows Ln
- 1357 Horse Creek Way
- 1428 Walker River Way
- 3175 Quick Cal Way
- 1434 Walker River Way
- 602 Tamsen Rd
- 1477 Green River Ln
- 132 Campfire Cir
- 1187 Jasmine Ln
- 112 Campfire Cir
- 1178 Jasmine Ln
- 1194 Jasmine Ln
- 0 Nevada Pacific Blvd
- 167 Country Ranch Rd
- 177 Country Ranch Rd
- 172 Country Ranch Rd
- 164 Country Ranch Rd
- 161 Country Ranch Rd
- 181 Country Ranch Rd
- 178 Country Ranch Rd
- 2875 Horseshoe Ln
- 158 Country Ranch Rd
- 2880 Horseshoe Ln
- 157 Country Ranch Rd
- 185 Country Ranch Rd
- 184 Country Ranch Rd
- 150 Country Ranch Rd
- 189 Country Ranch Rd
- 2885 Horseshoe Ln
- 141 Country Ranch Rd
- 142 Country Ranch Rd
- 192 Country Ranch Rd
- 188 Country Ranch Rd