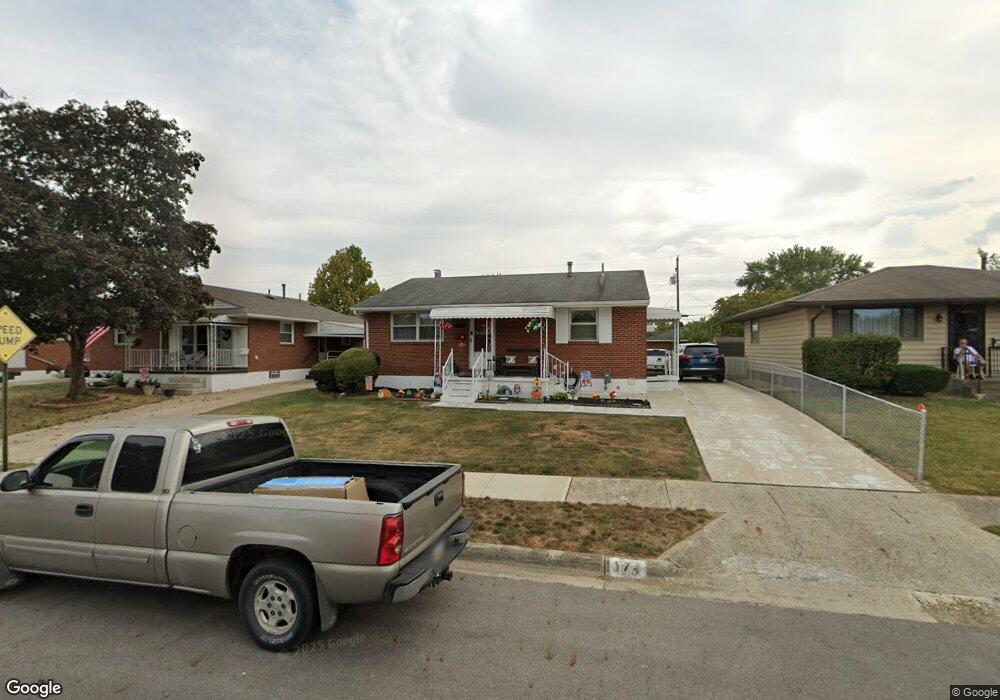
173 Cullman Rd Columbus, OH 43207
Obetz-Lockbourne NeighborhoodEstimated Value: $172,333 - $199,000
3
Beds
1
Bath
924
Sq Ft
$201/Sq Ft
Est. Value
About This Home
This home is located at 173 Cullman Rd, Columbus, OH 43207 and is currently estimated at $185,583, approximately $200 per square foot. 173 Cullman Rd is a home located in Franklin County with nearby schools including Parsons Elementary School, Buckeye Middle School, and Marion-Franklin High School.
Ownership History
Date
Name
Owned For
Owner Type
Purchase Details
Closed on
Jan 17, 2012
Sold by
Dillon Terry L and Dillon Rita E
Bought by
Dillon Terry L and Dillon Rita E
Current Estimated Value
Purchase Details
Closed on
Oct 19, 2011
Sold by
Maynard Wallace M and Maynard Tisha L
Bought by
Dillon Terry L and Dillon Terry
Home Financials for this Owner
Home Financials are based on the most recent Mortgage that was taken out on this home.
Original Mortgage
$79,433
Outstanding Balance
$54,567
Interest Rate
4.25%
Mortgage Type
FHA
Estimated Equity
$131,016
Purchase Details
Closed on
Nov 15, 2000
Sold by
Chambers Eunice M and Chambers Lewanna J
Bought by
Maynard Tisha L and Maynard Wallace M
Home Financials for this Owner
Home Financials are based on the most recent Mortgage that was taken out on this home.
Original Mortgage
$81,953
Interest Rate
7.87%
Mortgage Type
FHA
Purchase Details
Closed on
May 14, 1999
Sold by
Chambers Eunice M
Bought by
Chambers Eunice M and Charlton Lewanna J
Purchase Details
Closed on
May 13, 1986
Bought by
Chambers Eunice M
Purchase Details
Closed on
Mar 1, 1986
Purchase Details
Closed on
Dec 1, 1985
Create a Home Valuation Report for This Property
The Home Valuation Report is an in-depth analysis detailing your home's value as well as a comparison with similar homes in the area
Home Values in the Area
Average Home Value in this Area
Purchase History
| Date | Buyer | Sale Price | Title Company |
|---|---|---|---|
| Dillon Terry L | -- | None Available | |
| Dillon Terry L | $81,500 | Title First | |
| Maynard Tisha L | $82,000 | Chicago Title | |
| Chambers Eunice M | -- | -- | |
| Chambers Eunice M | $42,000 | -- | |
| -- | $8,300 | -- | |
| -- | -- | -- |
Source: Public Records
Mortgage History
| Date | Status | Borrower | Loan Amount |
|---|---|---|---|
| Open | Dillon Terry L | $79,433 | |
| Previous Owner | Maynard Tisha L | $81,953 |
Source: Public Records
Tax History Compared to Growth
Tax History
| Year | Tax Paid | Tax Assessment Tax Assessment Total Assessment is a certain percentage of the fair market value that is determined by local assessors to be the total taxable value of land and additions on the property. | Land | Improvement |
|---|---|---|---|---|
| 2024 | $1,976 | $53,830 | $15,120 | $38,710 |
| 2023 | $1,979 | $53,830 | $15,120 | $38,710 |
| 2022 | $968 | $27,410 | $8,230 | $19,180 |
| 2021 | $970 | $27,410 | $8,230 | $19,180 |
| 2020 | $971 | $27,410 | $8,230 | $19,180 |
| 2019 | $932 | $24,120 | $7,140 | $16,980 |
| 2018 | $1,042 | $24,120 | $7,140 | $16,980 |
| 2017 | $932 | $24,120 | $7,140 | $16,980 |
| 2016 | $1,271 | $27,930 | $5,600 | $22,330 |
| 2015 | $1,153 | $27,930 | $5,600 | $22,330 |
| 2014 | $1,156 | $27,930 | $5,600 | $22,330 |
| 2013 | $874 | $29,400 | $5,880 | $23,520 |
Source: Public Records
Map
Nearby Homes
- 202 Calahan Rd
- 2763 Parsons Ave
- 19 E Castle Rd
- 300 Loxley Dr
- 2808 Dolby Dr
- 0 Parsons Ave
- 228 Currier Dr
- 84 Betz Rd
- 82 Delray Rd
- 115 W Castle Rd
- 162 Phelps Rd
- 2769 Shelly Dr
- 1633-1635 E Greenway Ave
- 256 Rumsey Rd Unit 258
- 445 Basswood Rd
- 3380 Parsons Ave
- 574 Koebel Ave
- 3414 Parsons Ave
- 611 Lock Ave
- 125 Williams Rd