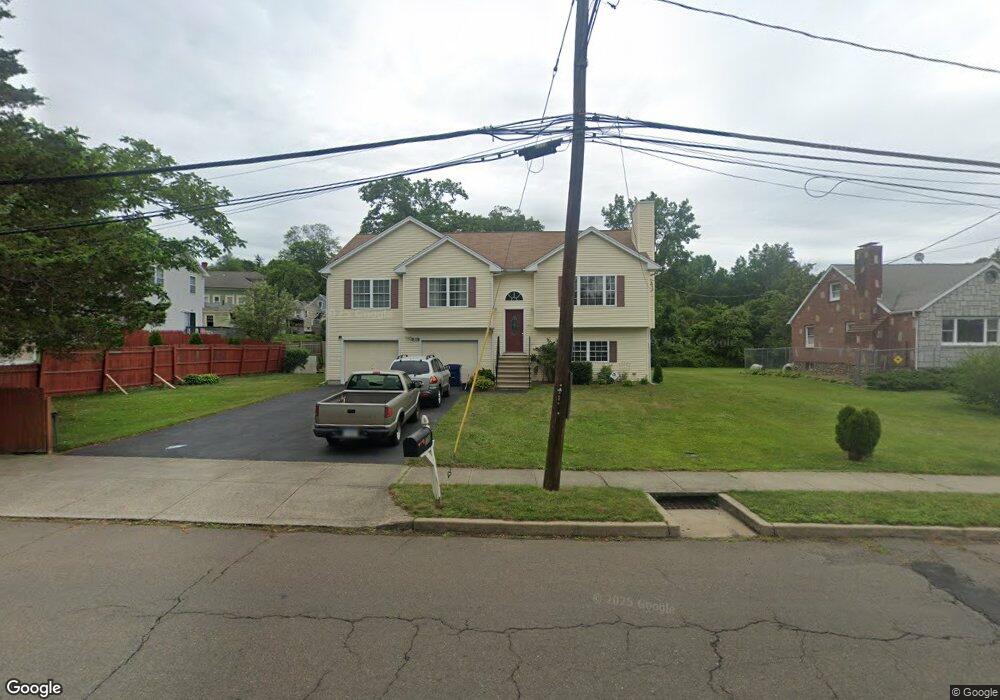
173 David St West Haven, CT 06516
Allingtown NeighborhoodEstimated Value: $453,557 - $523,000
4
Beds
7
Baths
1,532
Sq Ft
$311/Sq Ft
Est. Value
About This Home
This home is located at 173 David St, West Haven, CT 06516 and is currently estimated at $476,389, approximately $310 per square foot. 173 David St is a home located in New Haven County with nearby schools including Carrigan 5/6 Intermediate School, Harry M. Bailey Middle School, and West Haven High School.
Ownership History
Date
Name
Owned For
Owner Type
Purchase Details
Closed on
May 24, 2010
Sold by
Us Bk and Credit Susse 1St Bosto
Bought by
Clark Earle and Clark Jessie A
Current Estimated Value
Purchase Details
Closed on
Nov 12, 2009
Sold by
Teso Eung
Bought by
Us Bk
Purchase Details
Closed on
Nov 29, 2005
Sold by
Gaa Llc
Bought by
Testo Eung
Home Financials for this Owner
Home Financials are based on the most recent Mortgage that was taken out on this home.
Original Mortgage
$291,650
Interest Rate
6.06%
Mortgage Type
Purchase Money Mortgage
Create a Home Valuation Report for This Property
The Home Valuation Report is an in-depth analysis detailing your home's value as well as a comparison with similar homes in the area
Home Values in the Area
Average Home Value in this Area
Purchase History
| Date | Buyer | Sale Price | Title Company |
|---|---|---|---|
| Clark Earle | -- | -- | |
| Us Bk | -- | -- | |
| Testo Eung | $307,000 | -- | |
| Clark Earle | -- | -- | |
| Us Bk | -- | -- | |
| Testo Eung | $307,000 | -- |
Source: Public Records
Mortgage History
| Date | Status | Borrower | Loan Amount |
|---|---|---|---|
| Previous Owner | Testo Eung | $291,650 |
Source: Public Records
Tax History
| Year | Tax Paid | Tax Assessment Tax Assessment Total Assessment is a certain percentage of the fair market value that is determined by local assessors to be the total taxable value of land and additions on the property. | Land | Improvement |
|---|---|---|---|---|
| 2025 | $9,932 | $292,040 | $73,640 | $218,400 |
| 2024 | $9,333 | $194,880 | $50,960 | $143,920 |
| 2023 | $9,046 | $194,880 | $50,960 | $143,920 |
| 2022 | $8,888 | $194,880 | $50,960 | $143,920 |
| 2021 | $8,890 | $194,880 | $50,960 | $143,920 |
| 2020 | $9,171 | $178,080 | $43,190 | $134,890 |
| 2019 | $9,029 | $178,080 | $43,190 | $134,890 |
| 2018 | $8,783 | $178,080 | $43,190 | $134,890 |
| 2017 | $8,509 | $178,080 | $43,190 | $134,890 |
| 2016 | $8,250 | $178,080 | $43,190 | $134,890 |
| 2015 | $7,830 | $192,430 | $45,500 | $146,930 |
| 2014 | $7,674 | $192,430 | $45,500 | $146,930 |
Source: Public Records
Map
Nearby Homes
- 148 Burwell Rd
- 110 Fenwick St
- 23 Yates St
- 50 Morris Ave
- 50 Maltby Ave
- 34 Maltby Ave
- 127 Rangely St
- 38 Chauncey St
- 47 Dix St
- 690 Forest Rd Unit 702
- 690 Forest Rd Unit 761
- 690 Forest Rd Unit 501
- 690 Forest Rd Unit 651
- 45 Swampscott St
- 1 Rodney St
- 28 Terrace Ave
- 194 Homeside Ave
- 15 Crest St Unit 27
- 267 Front Ave
- 309 Terrace Ave Unit 44
Your Personal Tour Guide
Ask me questions while you tour the home.