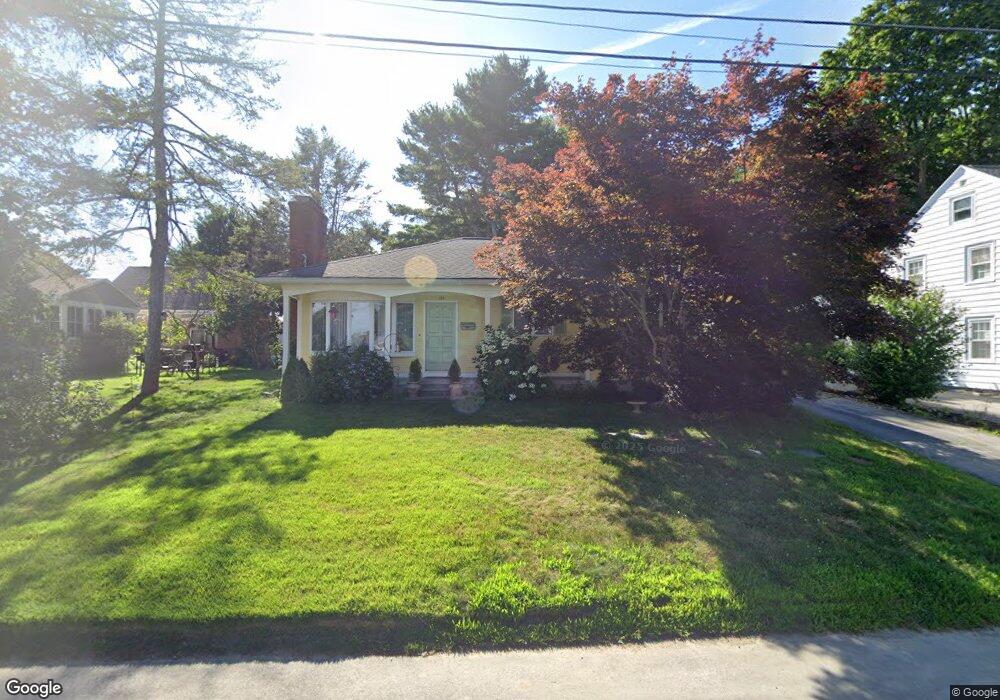
173 Dover Ave East Providence, RI 02914
Kent Heights NeighborhoodEstimated Value: $398,000 - $563,000
2
Beds
1
Bath
1,260
Sq Ft
$367/Sq Ft
Est. Value
About This Home
This home is located at 173 Dover Ave, East Providence, RI 02914 and is currently estimated at $462,429, approximately $367 per square foot. 173 Dover Ave is a home located in Providence County with nearby schools including East Providence High School, Highlander Charter School, and Times Squared Academy.
Ownership History
Date
Name
Owned For
Owner Type
Purchase Details
Closed on
Jun 21, 2000
Sold by
Moniz Joseph and Moniz Kathleen
Bought by
Orsi John R and Riendeau Karen A
Current Estimated Value
Home Financials for this Owner
Home Financials are based on the most recent Mortgage that was taken out on this home.
Original Mortgage
$112,000
Interest Rate
8.48%
Create a Home Valuation Report for This Property
The Home Valuation Report is an in-depth analysis detailing your home's value as well as a comparison with similar homes in the area
Home Values in the Area
Average Home Value in this Area
Purchase History
| Date | Buyer | Sale Price | Title Company |
|---|---|---|---|
| Orsi John R | $140,000 | -- |
Source: Public Records
Mortgage History
| Date | Status | Borrower | Loan Amount |
|---|---|---|---|
| Open | Orsi John R | $110,000 | |
| Closed | Orsi John R | $112,000 | |
| Previous Owner | Orsi John R | $100,000 |
Source: Public Records
Tax History Compared to Growth
Tax History
| Year | Tax Paid | Tax Assessment Tax Assessment Total Assessment is a certain percentage of the fair market value that is determined by local assessors to be the total taxable value of land and additions on the property. | Land | Improvement |
|---|---|---|---|---|
| 2025 | $5,122 | $391,900 | $125,600 | $266,300 |
| 2024 | $5,267 | $343,600 | $104,700 | $238,900 |
| 2023 | $5,072 | $343,600 | $104,700 | $238,900 |
| 2022 | $4,776 | $218,500 | $59,500 | $159,000 |
| 2021 | $4,698 | $218,500 | $56,300 | $162,200 |
| 2020 | $4,499 | $218,500 | $56,300 | $162,200 |
| 2019 | $4,374 | $218,500 | $56,300 | $162,200 |
| 2018 | $4,336 | $189,500 | $57,500 | $132,000 |
| 2017 | $4,239 | $189,500 | $57,500 | $132,000 |
| 2016 | $4,218 | $189,500 | $57,500 | $132,000 |
| 2015 | $4,030 | $175,600 | $50,700 | $124,900 |
| 2014 | $4,030 | $175,600 | $50,700 | $124,900 |
Source: Public Records
Map
Nearby Homes
- 25 Ide Ave
- 25 Fairview Ave
- 26 Mayflower St
- 132 S Rose St
- 180 Grassmere Ave
- 17 Brown St Unit 19
- 109 Bliss St
- 108 Bliss St
- 74 Brookhaven Dr
- 11 N Rose St
- 53 Wampanoag Trail
- 82 Martin St
- 87 Vincent Ave
- 108 Ivan Ave
- 400 Juniper St Unit A
- 400 Juniper St Unit B
- 400 Juniper St Unit C
- 10 Fairfield Ave
- 78 Ingraham St
- 9 Apulia St