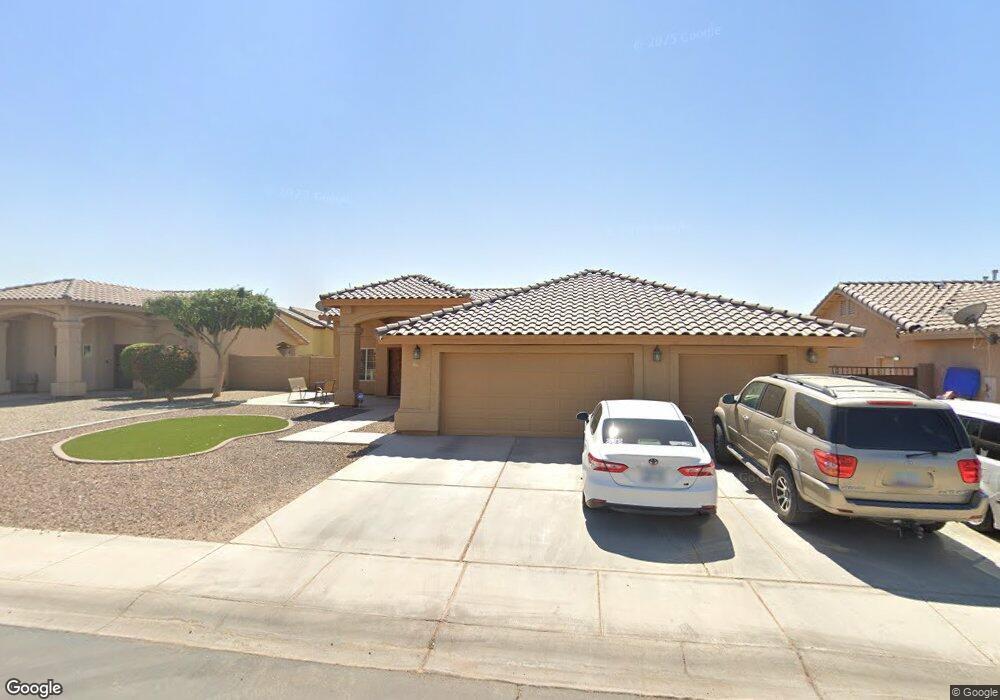
173 E 13th St Somerton, AZ 85350
Estimated Value: $288,067 - $369,000
3
Beds
2
Baths
1,281
Sq Ft
$249/Sq Ft
Est. Value
About This Home
This home is located at 173 E 13th St, Somerton, AZ 85350 and is currently estimated at $318,767, approximately $248 per square foot. 173 E 13th St is a home with nearby schools including Tierra Del Sol Elementary School, Somerton Middle School, and Kofa High School.
Ownership History
Date
Name
Owned For
Owner Type
Purchase Details
Closed on
May 28, 2021
Sold by
Ortega Omar Vargas and Vargas Omar
Bought by
Vargas Omar and Vargas Fernanda
Current Estimated Value
Home Financials for this Owner
Home Financials are based on the most recent Mortgage that was taken out on this home.
Original Mortgage
$125,000
Outstanding Balance
$91,118
Interest Rate
2.9%
Mortgage Type
New Conventional
Estimated Equity
$227,649
Purchase Details
Closed on
Oct 29, 2009
Sold by
Vargas Zonia F
Bought by
Ortega Omar Vargas
Home Financials for this Owner
Home Financials are based on the most recent Mortgage that was taken out on this home.
Original Mortgage
$149,940
Interest Rate
4.92%
Mortgage Type
New Conventional
Purchase Details
Closed on
Feb 12, 2009
Sold by
Rpia Llc
Bought by
Linton Management Inc
Purchase Details
Closed on
Aug 1, 2008
Sold by
Ab Builders Inc
Bought by
Rpia Llc
Create a Home Valuation Report for This Property
The Home Valuation Report is an in-depth analysis detailing your home's value as well as a comparison with similar homes in the area
Home Values in the Area
Average Home Value in this Area
Purchase History
| Date | Buyer | Sale Price | Title Company |
|---|---|---|---|
| Vargas Omar | -- | Chicago Title Agency | |
| Ortega Omar Vargas | -- | Citizens Title | |
| Ortega Omar Vargas | $147,000 | Citizens Title | |
| Linton Management Inc | -- | None Available | |
| Rpia Llc | -- | None Available |
Source: Public Records
Mortgage History
| Date | Status | Borrower | Loan Amount |
|---|---|---|---|
| Open | Vargas Omar | $125,000 | |
| Closed | Ortega Omar Vargas | $149,940 |
Source: Public Records
Tax History
| Year | Tax Paid | Tax Assessment Tax Assessment Total Assessment is a certain percentage of the fair market value that is determined by local assessors to be the total taxable value of land and additions on the property. | Land | Improvement |
|---|---|---|---|---|
| 2026 | $1,782 | $18,535 | $2,919 | $15,616 |
| 2025 | $1,831 | $17,652 | $2,805 | $14,847 |
| 2024 | $1,728 | $16,811 | $2,917 | $13,894 |
| 2023 | $1,728 | $16,010 | $3,340 | $12,670 |
| 2022 | $1,845 | $15,248 | $4,739 | $10,509 |
| 2021 | $1,738 | $14,522 | $3,950 | $10,572 |
| 2020 | $1,978 | $13,831 | $3,853 | $9,978 |
| 2019 | $1,861 | $13,172 | $3,300 | $9,872 |
| 2018 | $1,891 | $13,166 | $3,277 | $9,889 |
| 2017 | $1,859 | $13,166 | $3,277 | $9,889 |
| 2016 | $1,754 | $11,942 | $3,000 | $8,942 |
| 2015 | $1,651 | $12,038 | $2,950 | $9,088 |
| 2014 | $1,651 | $12,483 | $3,750 | $8,733 |
Source: Public Records
Map
Nearby Homes
- 153 E 12th Place
- 207 E 12th Place
- 263 E 13th St
- 517 13th Place
- 625 W 13 St
- 676 E 12th Place
- 662 W 13th Place
- 712 E 12th Place
- 569 W Ramona St
- 698 S Columbia Ave
- 828 W 13th St
- 1377 S Fresno Ave
- 862 W Patricia St
- 671 S Bingham Ave
- 650 W Orchid St
- 696 S Dalton Ave
- 844 W Main St
- 843 W Spring St
- 816 W Spring St
- 325 Toro Ave
- 427 E 13th St
- 155 E 13th St
- 190 E 13th St
- 172 13th St
- 154 13th St
- 174 E 13 Place
- 209 E 13th St
- 194 E 13 Place
- 156 13th Place
- 156 E 13th Place
- 208 13th St
- 210 13th Place
- 1346 S Musgrove Ave
- 1328 S Musgrove Ave
- 227 13th St
- 171 12th Place
- 1310 S Musgrove Ave
- 189 12th Place
- 228 13th Place
- 1364 S Musgrove Ave
Your Personal Tour Guide
Ask me questions while you tour the home.