Estimated Value: $94,000 - $165,000
--
Bed
--
Bath
1,520
Sq Ft
$79/Sq Ft
Est. Value
About This Home
This home is located at 173 Earlie Gaskins Rd, Lenox, GA 31637 and is currently estimated at $120,030, approximately $78 per square foot. 173 Earlie Gaskins Rd is a home with nearby schools including Berrien Primary School, Berrien Elementary School, and Berrien Middle School.
Ownership History
Date
Name
Owned For
Owner Type
Purchase Details
Closed on
Jan 8, 2021
Sold by
Baker John William
Bought by
Baker Joseph Michael
Current Estimated Value
Home Financials for this Owner
Home Financials are based on the most recent Mortgage that was taken out on this home.
Original Mortgage
$218,775
Outstanding Balance
$15,524
Interest Rate
2.71%
Mortgage Type
New Conventional
Estimated Equity
$104,506
Purchase Details
Closed on
Sep 15, 2006
Sold by
Hester Becky P
Bought by
Baker John W
Home Financials for this Owner
Home Financials are based on the most recent Mortgage that was taken out on this home.
Original Mortgage
$41,188
Interest Rate
6.48%
Mortgage Type
New Conventional
Purchase Details
Closed on
Dec 30, 2005
Sold by
Hester Becky
Bought by
Baker John
Home Financials for this Owner
Home Financials are based on the most recent Mortgage that was taken out on this home.
Original Mortgage
$92,469
Interest Rate
6.18%
Mortgage Type
New Conventional
Purchase Details
Closed on
Apr 25, 1994
Bought by
Baker J W
Create a Home Valuation Report for This Property
The Home Valuation Report is an in-depth analysis detailing your home's value as well as a comparison with similar homes in the area
Home Values in the Area
Average Home Value in this Area
Purchase History
| Date | Buyer | Sale Price | Title Company |
|---|---|---|---|
| Baker Joseph Michael | $60,000 | -- | |
| Baker John W | $38,500 | -- | |
| Baker John | $90,000 | -- | |
| Baker J W | -- | -- |
Source: Public Records
Mortgage History
| Date | Status | Borrower | Loan Amount |
|---|---|---|---|
| Open | Baker Joseph Michael | $218,775 | |
| Previous Owner | Baker John W | $41,188 | |
| Previous Owner | Baker John | $92,469 |
Source: Public Records
Tax History Compared to Growth
Tax History
| Year | Tax Paid | Tax Assessment Tax Assessment Total Assessment is a certain percentage of the fair market value that is determined by local assessors to be the total taxable value of land and additions on the property. | Land | Improvement |
|---|---|---|---|---|
| 2024 | $954 | $30,498 | $5,968 | $24,530 |
| 2023 | $959 | $30,498 | $5,968 | $24,530 |
| 2022 | $959 | $30,498 | $5,968 | $24,530 |
| 2021 | $965 | $30,498 | $5,968 | $24,530 |
| 2020 | $741 | $30,218 | $5,688 | $24,530 |
| 2019 | $741 | $30,218 | $5,688 | $24,530 |
| 2018 | $863 | $27,996 | $1,600 | $26,396 |
| 2017 | $824 | $27,996 | $1,600 | $26,396 |
| 2016 | $801 | $27,996 | $1,600 | $26,396 |
| 2015 | -- | $27,996 | $1,600 | $26,396 |
| 2014 | -- | $27,996 | $1,600 | $26,396 |
| 2013 | -- | $27,996 | $1,600 | $26,396 |
Source: Public Records
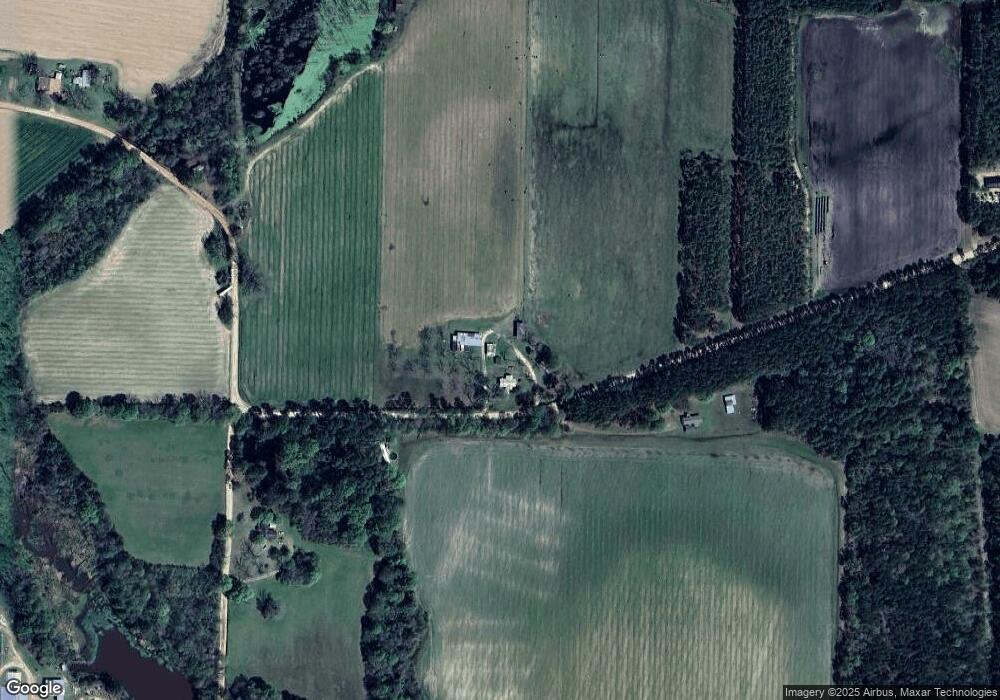
Map
Nearby Homes
- 69 Branch Ln
- 0 E 0 Hwy 125 S
- 2635 Brookfield-Lenox Rd
- 320 E Central Ave
- 77 S Bobby St
- 86 Owen Medford Rd
- 801 Broad St
- 411 S Robinson St
- 720 Vanceville County Line Rd
- 83 W Gray Ave
- 221 Rentz Bridge Rd
- 0 Baker Rd
- 58 Honeysuckle Ln
- 15150 U S 41
- 0 S Us Hwy 41 Lee Ball Rd Unit 134993
- 39 Paradise Lake Rd
- 287 Brookfield Nashville Rd
- 204 Brookfield Nashville Rd
- 5 Paradise Lake Rd
- 21 Brookfield-Lenox Rd
- 1346 Mallie Hester Rd
- 1110 Mallie Hester Rd
- 1456 Mallie Hester Rd
- 373 Earlie Gaskins Rd
- 806 Mallie Hester Rd
- 947 Mallie Hester Rd
- 397 Lindsey Goff Rd
- 699 Earlie Gaskins Rd
- 726 Mallie Hester Rd
- 173 Alvin Purvis Rd
- 359 Nichols Walker Rd
- 224 Alvin Purvis Rd
- 2062 Baker Sawmill Rd
- 188 Lindsey Goff Rd
- 836 Earlie Gaskins Rd
- 2066 Baker Sawmill Rd
- 2015 Baker Sawmill Rd
- 0 Baker Sawmill Rd
- 2292 Baker Sawmill Rd
- 1985 Baker Sawmill Rd