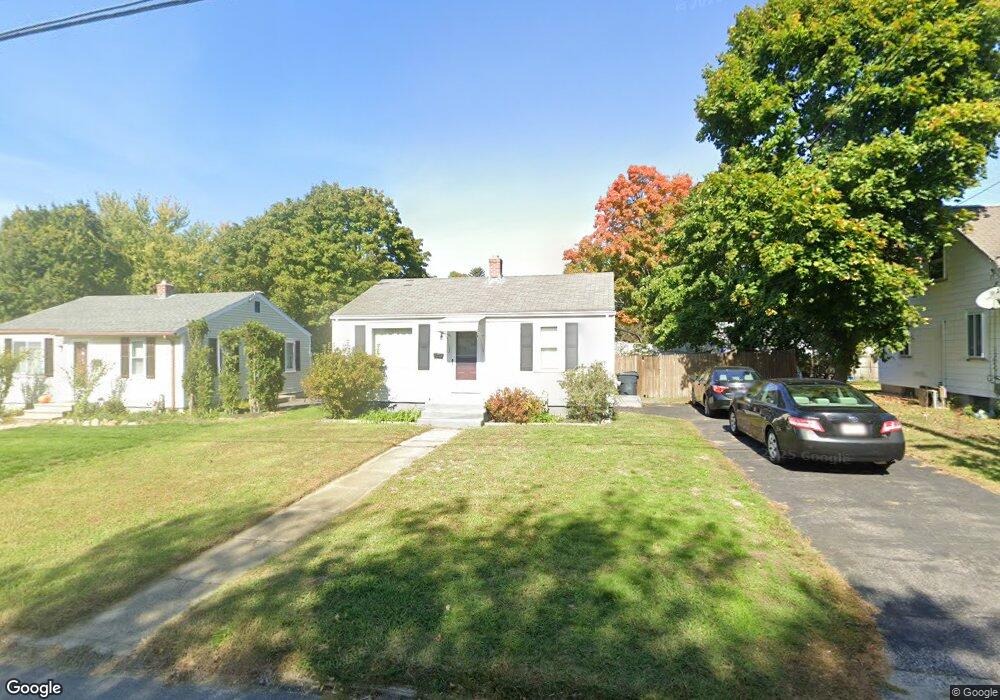
173 Easton Ave Warwick, RI 02888
Spring Green NeighborhoodEstimated Value: $313,000 - $346,000
2
Beds
1
Bath
672
Sq Ft
$486/Sq Ft
Est. Value
About This Home
This home is located at 173 Easton Ave, Warwick, RI 02888 and is currently estimated at $326,622, approximately $486 per square foot. 173 Easton Ave is a home located in Kent County with nearby schools including St. Peter School.
Ownership History
Date
Name
Owned For
Owner Type
Purchase Details
Closed on
Jul 31, 2002
Sold by
Salotto Pearl
Bought by
Joon Shirley S
Current Estimated Value
Home Financials for this Owner
Home Financials are based on the most recent Mortgage that was taken out on this home.
Original Mortgage
$103,184
Interest Rate
6.64%
Mortgage Type
Purchase Money Mortgage
Purchase Details
Closed on
Apr 20, 1993
Sold by
Iadeluca Gerald
Bought by
Salotto Pearl
Create a Home Valuation Report for This Property
The Home Valuation Report is an in-depth analysis detailing your home's value as well as a comparison with similar homes in the area
Home Values in the Area
Average Home Value in this Area
Purchase History
We collect this data history from publicly available records. To have your information removed, we recommend requesting removal directly through your county’s website.
| Date | Buyer | Sale Price | Title Company |
|---|---|---|---|
| Joon Shirley S | $104,000 | -- | |
| Salotto Pearl | $87,000 | -- | |
| Salotto Pearl | $87,000 | -- |
Source: Public Records
Mortgage History
We collect this data history from publicly available records. To have your information removed, we recommend requesting removal directly through your county’s website.
| Date | Status | Borrower | Loan Amount |
|---|---|---|---|
| Open | Salotto Pearl | $115,000 | |
| Closed | Salotto Pearl | $125,600 | |
| Closed | Salotto Pearl | $103,184 |
Source: Public Records
Tax History
| Year | Tax Paid | Tax Assessment Tax Assessment Total Assessment is a certain percentage of the fair market value that is determined by local assessors to be the total taxable value of land and additions on the property. | Land | Improvement |
|---|---|---|---|---|
| 2025 | $3,712 | $292,300 | $107,200 | $185,100 |
| 2024 | $3,332 | $230,300 | $93,200 | $137,100 |
| 2023 | $3,268 | $230,300 | $93,200 | $137,100 |
| 2022 | $2,982 | $159,200 | $56,400 | $102,800 |
| 2021 | $2,982 | $159,200 | $56,400 | $102,800 |
| 2020 | $2,982 | $159,200 | $56,400 | $102,800 |
| 2019 | $2,982 | $159,200 | $56,400 | $102,800 |
| 2018 | $2,305 | $110,800 | $50,100 | $60,700 |
| 2017 | $2,243 | $110,800 | $50,100 | $60,700 |
| 2016 | $2,243 | $110,800 | $50,100 | $60,700 |
| 2015 | $2,179 | $105,000 | $55,200 | $49,800 |
| 2014 | $2,106 | $105,000 | $55,200 | $49,800 |
| 2013 | $2,078 | $105,000 | $55,200 | $49,800 |
Source: Public Records
Map
Nearby Homes
- 153 Falcon Ave
- 26 Potomac Rd
- 87 Easton Ave
- 99 Potomac Rd
- 6 Christopher Rhodes Way
- 79 Bellevue Ave
- 130 Pilgrim Pkwy Unit 5
- 33 Pilgrim Dr
- 23 Astral St
- 110 Pilgrim Pkwy Unit 11
- 145 Massasoit Dr
- 369 Manor Dr
- 1153 Post Rd
- 5 Thayer Place
- 204 Harmony Ct
- 49 Recess Ln
- 5 Recess Ln
- 376 Norwood Ave
- 72 W Shore Rd Unit 202
- 72 W Shore Rd Unit 104
Your Personal Tour Guide
Ask me questions while you tour the home.