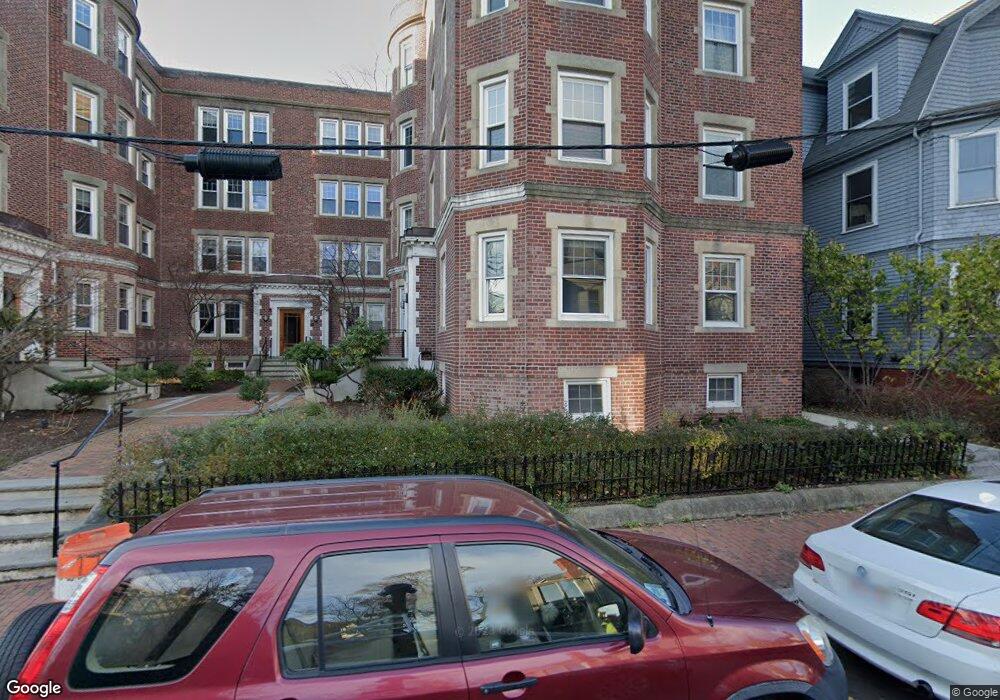
173 Hancock St Unit 4 Cambridge, MA 02139
Mid-Cambridge NeighborhoodEstimated Value: $837,906 - $904,000
2
Beds
1
Bath
906
Sq Ft
$966/Sq Ft
Est. Value
About This Home
This home is located at 173 Hancock St Unit 4, Cambridge, MA 02139 and is currently estimated at $874,977, approximately $965 per square foot. 173 Hancock St Unit 4 is a home located in Middlesex County with nearby schools including Prospect Hill Academy Charter School and Saint Paul's Choir School.
Ownership History
Date
Name
Owned For
Owner Type
Purchase Details
Closed on
Oct 6, 2014
Sold by
Monahan Logan
Bought by
Sharma Neal K and Sharma Logan
Current Estimated Value
Home Financials for this Owner
Home Financials are based on the most recent Mortgage that was taken out on this home.
Original Mortgage
$412,500
Outstanding Balance
$315,445
Interest Rate
4.11%
Mortgage Type
New Conventional
Estimated Equity
$559,532
Purchase Details
Closed on
Sep 16, 2009
Sold by
173-4 Hancock Street R and 173-4 Christakis
Bought by
Monahan Logan
Home Financials for this Owner
Home Financials are based on the most recent Mortgage that was taken out on this home.
Original Mortgage
$306,000
Interest Rate
5.28%
Mortgage Type
Purchase Money Mortgage
Purchase Details
Closed on
Mar 30, 2007
Sold by
Christakis George
Bought by
173-4 Hancock Street R and 173-4 Christakis
Purchase Details
Closed on
Nov 18, 1998
Sold by
Georgopoulos Chris
Bought by
Christakis George
Create a Home Valuation Report for This Property
The Home Valuation Report is an in-depth analysis detailing your home's value as well as a comparison with similar homes in the area
Home Values in the Area
Average Home Value in this Area
Purchase History
| Date | Buyer | Sale Price | Title Company |
|---|---|---|---|
| Sharma Neal K | -- | -- | |
| Sharma Neal K | -- | -- | |
| Sharma Neal K | -- | -- | |
| Monahan Logan | $360,000 | -- | |
| Monahan Logan | $360,000 | -- | |
| 173-4 Hancock Street R | -- | -- | |
| 173-4 Hancock Street R | -- | -- | |
| Christakis George | $60,000 | -- |
Source: Public Records
Mortgage History
| Date | Status | Borrower | Loan Amount |
|---|---|---|---|
| Open | Sharma Neal K | $412,500 | |
| Closed | Christakis George | $412,500 | |
| Previous Owner | Monahan Logan | $306,000 |
Source: Public Records
Tax History Compared to Growth
Tax History
| Year | Tax Paid | Tax Assessment Tax Assessment Total Assessment is a certain percentage of the fair market value that is determined by local assessors to be the total taxable value of land and additions on the property. | Land | Improvement |
|---|---|---|---|---|
| 2025 | $5,477 | $862,500 | $0 | $862,500 |
| 2024 | $5,030 | $849,700 | $0 | $849,700 |
| 2023 | $4,931 | $841,500 | $0 | $841,500 |
| 2022 | $4,911 | $829,600 | $0 | $829,600 |
| 2021 | $4,807 | $821,700 | $0 | $821,700 |
| 2020 | $4,616 | $802,800 | $0 | $802,800 |
| 2019 | $4,418 | $743,800 | $0 | $743,800 |
| 2018 | $4,288 | $681,700 | $0 | $681,700 |
| 2017 | $4,100 | $631,800 | $0 | $631,800 |
| 2016 | $3,933 | $562,600 | $0 | $562,600 |
| 2015 | $3,299 | $421,900 | $0 | $421,900 |
| 2014 | $3,153 | $376,200 | $0 | $376,200 |
Source: Public Records
Map
Nearby Homes
- 8 Chatham St Unit 4
- 329 Harvard St Unit 1
- 338 Harvard St Unit 10
- 5 Centre St Unit 32
- 2 Ellery Square
- 10 Dana St Unit 202
- 54 Ellery St Unit 3
- 60 Ellery St
- 11 Dana St Unit D
- 285 Harvard St Unit 408
- 55 Ellery St Unit 3
- 931 Massachusetts Ave Unit 1003
- 280 Harvard St Unit 1A
- 67 Inman St
- 17 Marie Ave Unit 3
- 930 Massachusetts Ave
- 22 Bigelow St Unit 2B
- 22 Bigelow St Unit 1C
- 950 Massachusetts Ave Unit 512
- 950 Massachusetts Ave Unit 504
- 175 Hancock St Unit 4
- 175 Hancock St Unit 3
- 175 Hancock St Unit 2
- 175 Hancock St Unit 1
- 173 Hancock St Unit 8
- 173 Hancock St Unit 6
- 173 Hancock St Unit 5
- 173 Hancock St Unit 3
- 173 Hancock St Unit 2
- 173 Hancock St Unit 1
- 171 Hancock St Unit 4
- 171 Hancock St Unit 3
- 171 Hancock St Unit 2
- 171 Hancock St Unit 1
- 171 Hancock St
- 173 Hancock St Unit Hancock St
- 173 Hancock St
- 175 Hancock St
- 175 Hancock St Unit 175
- 173 Hancock St Unit 6,173