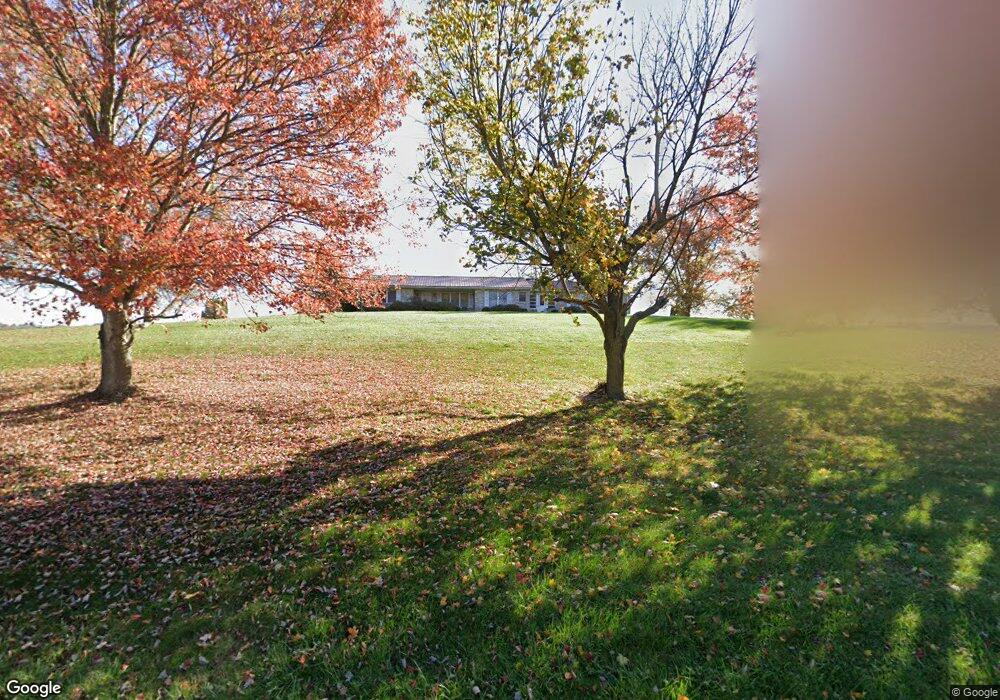
173 Hickory Rd Dillsburg, PA 17019
Estimated Value: $327,000 - $389,000
3
Beds
3
Baths
1,577
Sq Ft
$230/Sq Ft
Est. Value
About This Home
This home is located at 173 Hickory Rd, Dillsburg, PA 17019 and is currently estimated at $362,396, approximately $229 per square foot. 173 Hickory Rd is a home located in York County with nearby schools including Northern Middle School and Northern High School.
Ownership History
Date
Name
Owned For
Owner Type
Purchase Details
Closed on
Jun 20, 2019
Sold by
Jeter Dawn A and Jeter Robert G
Bought by
Jeter Robert G
Current Estimated Value
Purchase Details
Closed on
Jan 9, 2018
Sold by
Stutting Brandi Lynn and Wendler Rebecca Joann
Bought by
Jeter Dawn A and Jeter Robert G
Home Financials for this Owner
Home Financials are based on the most recent Mortgage that was taken out on this home.
Original Mortgage
$118,462
Outstanding Balance
$99,866
Interest Rate
3.9%
Mortgage Type
VA
Estimated Equity
$262,531
Purchase Details
Closed on
Mar 17, 2014
Sold by
Miller Jason Keith and Miller Patricia
Bought by
Myers Nanci L
Purchase Details
Closed on
Dec 1, 2008
Sold by
Miller Keith E
Bought by
Miller Keith E and Myers Nanci L
Purchase Details
Closed on
Sep 19, 2006
Sold by
Miller Keith E and Miller Jill A
Bought by
Miller Keith E
Create a Home Valuation Report for This Property
The Home Valuation Report is an in-depth analysis detailing your home's value as well as a comparison with similar homes in the area
Home Values in the Area
Average Home Value in this Area
Purchase History
| Date | Buyer | Sale Price | Title Company |
|---|---|---|---|
| Jeter Robert G | -- | None Available | |
| Jeter Dawn A | $160,000 | None Available | |
| Myers Nanci L | -- | None Available | |
| Miller Keith E | $103,541 | None Available | |
| Miller Keith E | -- | None Available |
Source: Public Records
Mortgage History
| Date | Status | Borrower | Loan Amount |
|---|---|---|---|
| Open | Jeter Dawn A | $118,462 |
Source: Public Records
Tax History Compared to Growth
Tax History
| Year | Tax Paid | Tax Assessment Tax Assessment Total Assessment is a certain percentage of the fair market value that is determined by local assessors to be the total taxable value of land and additions on the property. | Land | Improvement |
|---|---|---|---|---|
| 2025 | $4,428 | $156,880 | $50,630 | $106,250 |
| 2024 | $4,381 | $156,880 | $50,630 | $106,250 |
| 2023 | $4,204 | $156,880 | $50,630 | $106,250 |
| 2022 | $4,116 | $156,880 | $50,630 | $106,250 |
| 2021 | $3,851 | $156,880 | $50,630 | $106,250 |
| 2020 | $3,761 | $156,880 | $50,630 | $106,250 |
| 2019 | $3,668 | $156,880 | $50,630 | $106,250 |
| 2018 | $3,590 | $156,880 | $50,630 | $106,250 |
| 2017 | $3,590 | $156,880 | $50,630 | $106,250 |
| 2016 | $0 | $156,880 | $50,630 | $106,250 |
| 2015 | -- | $156,880 | $50,630 | $106,250 |
| 2014 | -- | $156,880 | $50,630 | $106,250 |
Source: Public Records
Map
Nearby Homes
- 78 Walmar Manor
- 65 Walmar Manor
- 0 S Mountain Rd Unit PAYK2060260
- 470 Capitol Hill Rd
- 200 Franklintown Rd
- 771 Range End Rd
- 111 Saint George Dr
- 455 Scotch Pine Rd
- 104 Furman Rd
- 0 Church St Unit PAYK2054218
- 112 W South St
- lot 1 Baltimore St
- 155 Coffeetown Rd
- 45 Chain Saw Rd
- 165 Chain Saw Rd
- 0 Range End Rd Unit PAYK2075290
- 385 Latimore Creek Rd
- 220 Stone Head Rd
- 124 Big Dam Rd
- 307 Route 15 S
- 163 Hickory Rd
- 166 Hickory Rd
- 184 Hickory Rd
- 100 Lake Dr
- 151 Hickory Rd
- 33 Water St
- 145 Hickory Rd
- 141 Hickory Rd
- 17 Water St
- 30 Capitol Hill Rd
- 38 Capitol Hill Rd
- 53 Water St
- 34 Capitol Hill Rd
- 14 Capitol Hill Rd
- 16 Capitol Hill Rd
- 133 Hickory Rd
- 20 Mill Dr
- 102 Mill Dr
- 25 Capitol Hill Rd
- 23 Capitol Hill Rd