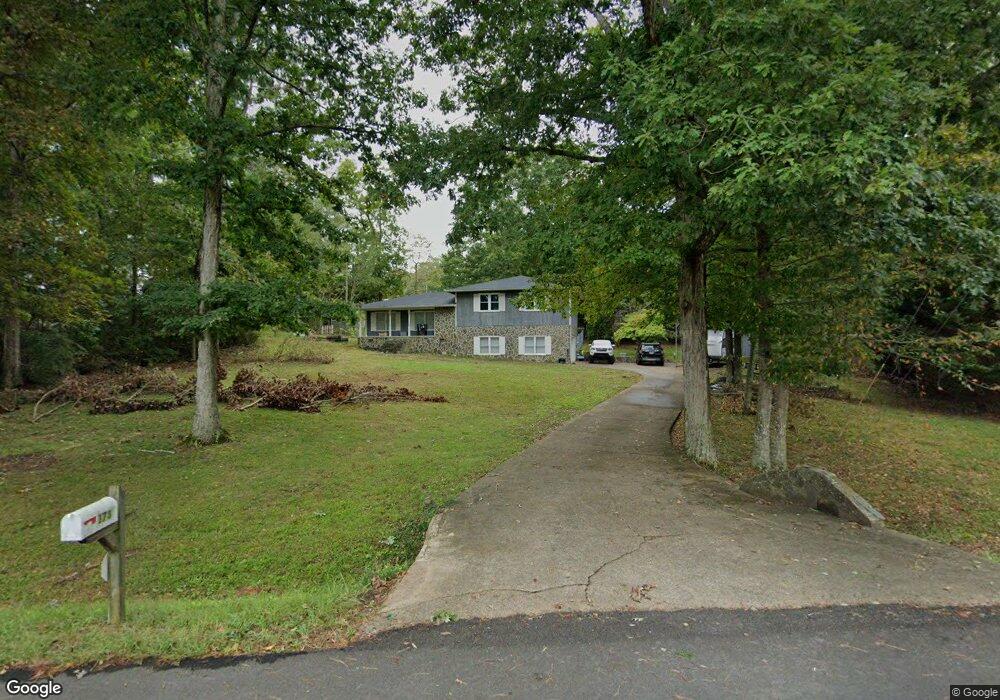
173 Holcomb Rd Dalton, GA 30721
Estimated Value: $268,000 - $326,000
3
Beds
2
Baths
1,652
Sq Ft
$178/Sq Ft
Est. Value
About This Home
This home is located at 173 Holcomb Rd, Dalton, GA 30721 and is currently estimated at $294,667, approximately $178 per square foot. 173 Holcomb Rd is a home located in Whitfield County with nearby schools including Beaverdale Elementary School, Coahulla Creek High School, and Cedar Valley Christian Academy.
Ownership History
Date
Name
Owned For
Owner Type
Purchase Details
Closed on
Mar 28, 2022
Sold by
Elizabeth Wells Marion
Bought by
Wells Jason William Tyle and Wells Morgan Jade
Current Estimated Value
Home Financials for this Owner
Home Financials are based on the most recent Mortgage that was taken out on this home.
Original Mortgage
$164,900
Outstanding Balance
$153,878
Interest Rate
4.42%
Mortgage Type
New Conventional
Estimated Equity
$140,789
Purchase Details
Closed on
May 14, 2020
Sold by
Thomason Robert William
Bought by
Wells Marion Elizabeth
Purchase Details
Closed on
Nov 22, 2010
Sold by
Beavers Barbara J
Bought by
Thomason Rebecca L
Home Financials for this Owner
Home Financials are based on the most recent Mortgage that was taken out on this home.
Original Mortgage
$86,900
Interest Rate
4.3%
Mortgage Type
New Conventional
Create a Home Valuation Report for This Property
The Home Valuation Report is an in-depth analysis detailing your home's value as well as a comparison with similar homes in the area
Purchase History
| Date | Buyer | Sale Price | Title Company |
|---|---|---|---|
| Wells Jason William Tyle | $170,000 | New Title Company Name | |
| Wells Marion Elizabeth | -- | -- | |
| Wells Marion Elizabeth | -- | -- | |
| Thomason Rebecca L | $129,900 | -- |
Source: Public Records
Mortgage History
| Date | Status | Borrower | Loan Amount |
|---|---|---|---|
| Open | Wells Jason William Tyle | $164,900 | |
| Previous Owner | Thomason Rebecca L | $86,900 |
Source: Public Records
Tax History
| Year | Tax Paid | Tax Assessment Tax Assessment Total Assessment is a certain percentage of the fair market value that is determined by local assessors to be the total taxable value of land and additions on the property. | Land | Improvement |
|---|---|---|---|---|
| 2025 | $2,170 | $78,789 | $6,494 | $72,295 |
| 2024 | $2,170 | $78,789 | $6,494 | $72,295 |
| 2023 | $1,585 | $53,737 | $4,351 | $49,386 |
| 2022 | $1,190 | $40,340 | $3,668 | $36,672 |
| 2021 | $1,190 | $40,340 | $3,668 | $36,672 |
| 2020 | $1,271 | $40,340 | $3,668 | $36,672 |
| 2019 | $958 | $40,340 | $3,668 | $36,672 |
| 2018 | $958 | $39,690 | $3,018 | $36,672 |
| 2017 | $958 | $39,690 | $3,018 | $36,672 |
| 2016 | $835 | $36,415 | $3,018 | $33,397 |
| 2014 | $779 | $36,334 | $2,938 | $33,397 |
| 2013 | -- | $36,334 | $2,937 | $33,396 |
Source: Public Records
Map
Nearby Homes
- 1168 Beaverdale Rd NE
- 1222 Beaverdale Cutoff Rd NE
- 2286 Dawnville Beaverdale Rd
- 2286 Dawnville Beaverdale Rd NE
- 1759 Beaverdale Rd
- 2217 Mccamish Rd NE
- 1077 Boyd Rd NE
- 1379 Presley Rd NE
- 1597 Beaverdale Rd NE
- 2227 Cave Hollow Rd NE
- 828 Nelson Kile Rd NE
- 1207 Lee Bryant Rd NE
- 143 Meridian Way
- 1746 Rainbow Cir NE
- 3050 Cleveland Hwy
- 3147 Cleveland Hwy
- 222 Pacer Ln
- 230 Pacer Ln
- 279 Kempton Ln
- 0 Pacer Ln
- 183 Holcomb Rd
- 179 Holcomb Rd
- 1175 Beaverdale Rd NE
- 1167 Beaverdale Rd NE
- 288 Holcomb Rd
- 197 Holcomb Rd
- 134 Holcomb Rd
- 1178 Beaverdale Rd NE
- Lot 3 Beaverdale Rd NE
- Lot 1 Beaverdale Rd NE
- Lot 2 Beaverdale Rd NE
- 1174A Beaverdale Rd NE
- 211 Holcomb Rd
- 1161 Beaverdale Rd NE
- 1153 Beaverdale Rd NE
- 303 Holcomb Rd
- 230 Holcomb Rd
- 310 Holcomb Rd
- 1223 Beaverdale Rd NE
- 1227 Beaverdale Cutoff Rd NE
Your Personal Tour Guide
Ask me questions while you tour the home.