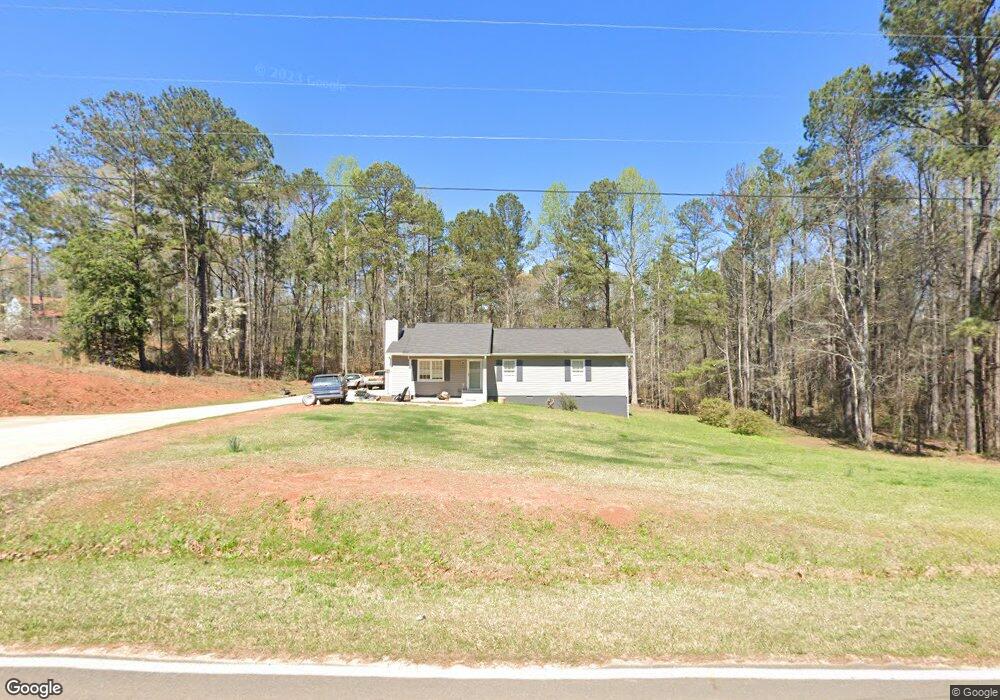
173 Leonard Rd Lagrange, GA 30241
Estimated Value: $170,000 - $201,434
3
Beds
2
Baths
1,378
Sq Ft
$133/Sq Ft
Est. Value
About This Home
This home is located at 173 Leonard Rd, Lagrange, GA 30241 and is currently estimated at $182,609, approximately $132 per square foot. 173 Leonard Rd is a home located in Troup County with nearby schools including Callaway Elementary School, Hogansville Elementary School, and Callaway Middle School.
Ownership History
Date
Name
Owned For
Owner Type
Purchase Details
Closed on
Mar 28, 2025
Sold by
Mcleod-Hanie Megan
Bought by
Ivester Matthew
Current Estimated Value
Home Financials for this Owner
Home Financials are based on the most recent Mortgage that was taken out on this home.
Original Mortgage
$161,000
Outstanding Balance
$159,871
Interest Rate
6.76%
Mortgage Type
New Conventional
Estimated Equity
$22,738
Purchase Details
Closed on
Jun 30, 2006
Sold by
Wells Fargo Financial Inc
Bought by
Godwin Russell and Godwin Megan
Home Financials for this Owner
Home Financials are based on the most recent Mortgage that was taken out on this home.
Original Mortgage
$84,750
Interest Rate
6.6%
Mortgage Type
New Conventional
Purchase Details
Closed on
Mar 7, 2006
Sold by
Mullins Curtis
Bought by
Wells Fargo Financial Georgia
Purchase Details
Closed on
Nov 6, 1990
Bought by
Mullins Curtis
Purchase Details
Closed on
Oct 12, 1990
Create a Home Valuation Report for This Property
The Home Valuation Report is an in-depth analysis detailing your home's value as well as a comparison with similar homes in the area
Home Values in the Area
Average Home Value in this Area
Purchase History
| Date | Buyer | Sale Price | Title Company |
|---|---|---|---|
| Ivester Matthew | $175,000 | -- | |
| Godwin Russell | $84,750 | -- | |
| Wells Fargo Financial Georgia | -- | -- | |
| Mullins Curtis | $75,800 | -- | |
| -- | $17,800 | -- |
Source: Public Records
Mortgage History
| Date | Status | Borrower | Loan Amount |
|---|---|---|---|
| Open | Ivester Matthew | $161,000 | |
| Previous Owner | Godwin Russell | $84,750 |
Source: Public Records
Tax History
| Year | Tax Paid | Tax Assessment Tax Assessment Total Assessment is a certain percentage of the fair market value that is determined by local assessors to be the total taxable value of land and additions on the property. | Land | Improvement |
|---|---|---|---|---|
| 2025 | $1,654 | $67,040 | $14,040 | $53,000 |
| 2024 | $1,435 | $54,600 | $14,040 | $40,560 |
| 2023 | $909 | $53,240 | $14,040 | $39,200 |
| 2022 | $1,312 | $49,000 | $11,920 | $37,080 |
| 2021 | $1,086 | $38,000 | $11,920 | $26,080 |
| 2020 | $1,086 | $38,000 | $11,920 | $26,080 |
| 2019 | $894 | $31,632 | $9,792 | $21,840 |
| 2018 | $835 | $29,672 | $9,792 | $19,880 |
| 2017 | $835 | $29,672 | $9,792 | $19,880 |
| 2016 | $814 | $28,965 | $9,792 | $19,173 |
| 2015 | $815 | $28,965 | $9,792 | $19,173 |
| 2014 | $786 | $27,956 | $9,792 | $18,164 |
| 2013 | -- | $29,421 | $9,792 | $19,629 |
Source: Public Records
Map
Nearby Homes
- 106 Jandale Dr
- 104 Canterbury Dr
- 102 Canterbury Dr
- 100 Canterbury Dr
- 207 N View Pointe Dr
- 101 Sheffield Dr
- 250 Mobley Bridge Rd
- 113 Wellington Dr
- 3647 Youngs Mill Rd
- 3315 Hammett Rd
- 24 N Brooks Rd
- 789 Hammett Rd
- SMOKEMONT Smokemont Dr
- 178 Waterview Dr
- 801 Marwari Way Unit 61
- 91 Richmond Dr
- 119 Cedar Ridge Dr
- 209 River Oaks Dr
- 0 Waterview Dr Unit 10558462
- 109 Windridge
- 153 Leonard Rd
- 153 Leonard Rd Unit 11
- 147 Leonard Rd
- 143 Leonard Rd
- 211 Leonard Rd
- 71 Leonard Rd
- 79 Leonard Rd
- 76 Leonard Rd
- 2616 Youngs Mill Rd
- 63 Leonard Rd
- 2580 Youngs Mill Rd
- 315 Leonard Rd
- 2554 Youngs Mill Rd
- 51 Leonard Rd
- 2630 Youngs Mill Rd
- 325 Leonard Rd
- 2604 Youngs Mill Rd
- 2538 Youngs Mill Rd
- 2486 Youngs Mill Rd
- 2518 Youngs Mill Rd
Your Personal Tour Guide
Ask me questions while you tour the home.