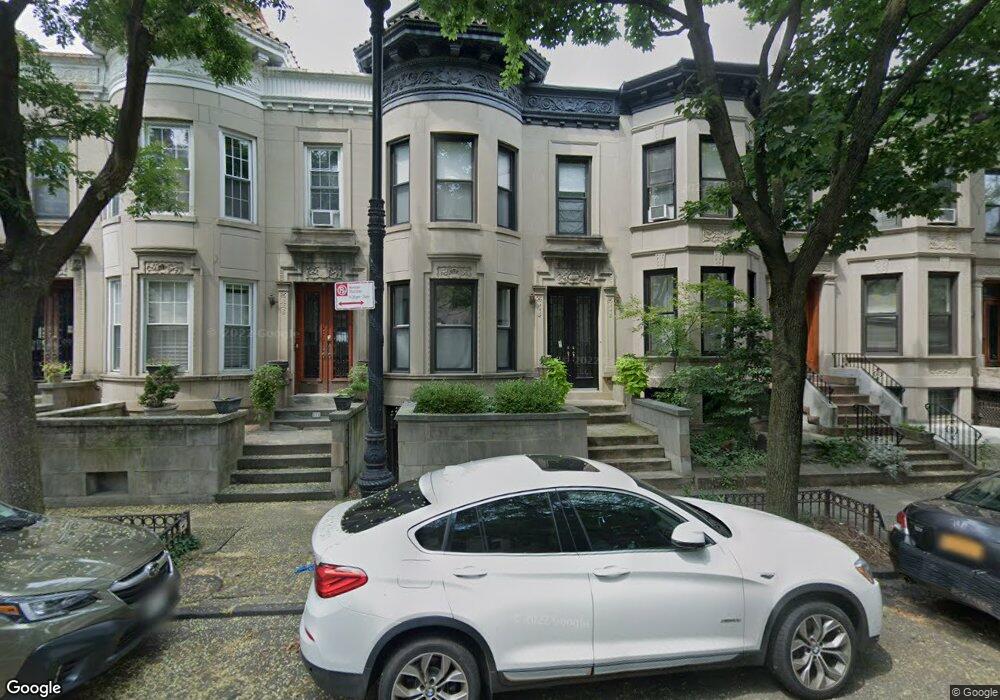
173 Maple St Brooklyn, NY 11225
Prospect Lefferts Gardens NeighborhoodEstimated Value: $1,749,000 - $2,128,000
Studio
--
Bath
2,180
Sq Ft
$890/Sq Ft
Est. Value
About This Home
This home is located at 173 Maple St, Brooklyn, NY 11225 and is currently estimated at $1,940,333, approximately $890 per square foot. 173 Maple St is a home located in Kings County with nearby schools including P.S. 92 - Adrian Hegeman, M.S. 61 Dr. Gladstone H. Atwell Middle School, and Achievement First Voyager Middle School.
Ownership History
Date
Name
Owned For
Owner Type
Purchase Details
Closed on
Feb 2, 2017
Sold by
Lucas Samantha J and Wojtkowiak Matthew
Bought by
Lucas Samantha J
Current Estimated Value
Purchase Details
Closed on
Jan 28, 2010
Sold by
Denise Mercer Harrison Irrevocable Trust and Evans
Bought by
Lucas Samantha J and Wojtkowiak Matthew
Home Financials for this Owner
Home Financials are based on the most recent Mortgage that was taken out on this home.
Original Mortgage
$417,000
Interest Rate
5%
Mortgage Type
Purchase Money Mortgage
Purchase Details
Closed on
Sep 17, 2006
Sold by
Mercer Harrison Denise and Mercer Hal S
Bought by
Denise Mercer Harrison Irrevocable Trust and Rainel Harrison Evans
Purchase Details
Closed on
May 29, 2002
Sold by
Mercer S Hal 111 and Mercer Heir
Bought by
Mercer S Hal 111 and Harrison Denise Mercer
Create a Home Valuation Report for This Property
The Home Valuation Report is an in-depth analysis detailing your home's value as well as a comparison with similar homes in the area
Home Values in the Area
Average Home Value in this Area
Purchase History
| Date | Buyer | Sale Price | Title Company |
|---|---|---|---|
| Lucas Samantha J | -- | -- | |
| Lucas Samantha J | -- | -- | |
| Lucas Samantha J | -- | -- | |
| Lucas Samantha J | $835,000 | -- | |
| Lucas Samantha J | $835,000 | -- | |
| Denise Mercer Harrison Irrevocable Trust | -- | -- | |
| Denise Mercer Harrison Irrevocable Trust | -- | -- | |
| Mercer S Hal 111 | -- | -- | |
| Harrison Mercer S | -- | -- |
Source: Public Records
Mortgage History
| Date | Status | Borrower | Loan Amount |
|---|---|---|---|
| Previous Owner | Lucas Samantha J | $417,000 |
Source: Public Records
Tax History
| Year | Tax Paid | Tax Assessment Tax Assessment Total Assessment is a certain percentage of the fair market value that is determined by local assessors to be the total taxable value of land and additions on the property. | Land | Improvement |
|---|---|---|---|---|
| 2025 | $8,391 | $127,380 | $23,280 | $104,100 |
| 2024 | $8,391 | $143,640 | $23,280 | $120,360 |
| 2023 | $8,004 | $137,520 | $23,280 | $114,240 |
| 2022 | $6,382 | $131,220 | $23,280 | $107,940 |
| 2021 | $6,221 | $107,940 | $23,280 | $84,660 |
| 2020 | $3,082 | $91,620 | $23,280 | $68,340 |
| 2019 | $7,283 | $91,620 | $23,280 | $68,340 |
| 2018 | $6,695 | $32,844 | $7,780 | $25,064 |
| 2017 | $6,380 | $31,296 | $6,923 | $24,373 |
| 2014 | $3,561 | $29,012 | $11,830 | $17,182 |
Source: Public Records
Map
Nearby Homes
- 212 Lincoln Rd
- 224 Lefferts Ave Unit 14
- 195 Rutland Rd
- 125 Midwood St
- 291 Lincoln Rd Unit HSE
- 185 Lefferts Ave
- 246 Maple St Unit 3A
- 426 Rogers Ave
- 237 Rutland Rd Unit 1 B
- 125 Rutland Rd
- 265 Maple St
- 250 Midwood St
- 322 Lincoln Rd Unit 3 B
- 322 Lincoln Rd Unit 4-B
- 322 Lincoln Rd Unit 4-A
- 322 Lincoln Rd Unit 2-F
- 251 Rutland Rd
- 277 Maple St
- 267 Rutland Rd
- 340 Lincoln Rd
Your Personal Tour Guide
Ask me questions while you tour the home.