Estimated Value: $124,000 - $189,000
--
Bed
2
Baths
1,225
Sq Ft
$124/Sq Ft
Est. Value
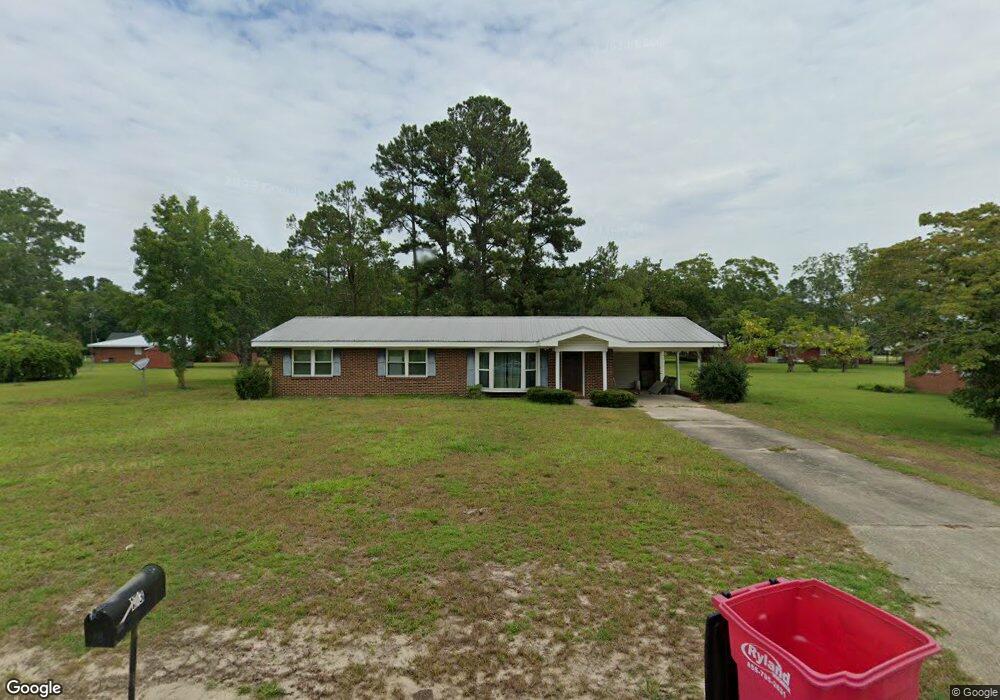
About This Home
This home is located at 173 Morris Dr, Alma, GA 31510 and is currently estimated at $151,871, approximately $123 per square foot. 173 Morris Dr is a home located in Bacon County with nearby schools including Bacon County Primary School, Bacon County Elementary School, and Bacon County Middle School.
Ownership History
Date
Name
Owned For
Owner Type
Purchase Details
Closed on
Aug 24, 2006
Sold by
Tanner Jerry L
Bought by
Mizell Eric
Current Estimated Value
Home Financials for this Owner
Home Financials are based on the most recent Mortgage that was taken out on this home.
Original Mortgage
$66,210
Outstanding Balance
$44,982
Interest Rate
6.67%
Mortgage Type
New Conventional
Estimated Equity
$106,889
Purchase Details
Closed on
Jan 13, 2006
Sold by
Brigman Wood Freddie Ann
Bought by
Tanner Jerry L and Tanner Sharon L
Purchase Details
Closed on
Nov 21, 2003
Sold by
Wood Willis M
Bought by
Wood Freddie A
Purchase Details
Closed on
May 15, 2000
Sold by
Wood Willis M
Bought by
Wood Willis M
Purchase Details
Closed on
Mar 24, 2000
Sold by
Taylor Thomas G
Bought by
Wood Willis M
Purchase Details
Closed on
Jul 7, 1999
Sold by
Davis Billy J
Bought by
Taylor Thomas G
Create a Home Valuation Report for This Property
The Home Valuation Report is an in-depth analysis detailing your home's value as well as a comparison with similar homes in the area
Home Values in the Area
Average Home Value in this Area
Purchase History
| Date | Buyer | Sale Price | Title Company |
|---|---|---|---|
| Mizell Eric | $73,000 | -- | |
| Tanner Jerry L | $68,000 | -- | |
| Wood Freddie A | -- | -- | |
| Wood Willis M | -- | -- | |
| Wood Willis M | $58,000 | -- | |
| Taylor Thomas G | -- | -- | |
| Taylor Thomas G | $59,900 | -- |
Source: Public Records
Mortgage History
| Date | Status | Borrower | Loan Amount |
|---|---|---|---|
| Open | Mizell Eric | $66,210 | |
| Closed | Mizell Eric | $10,000 |
Source: Public Records
Tax History Compared to Growth
Tax History
| Year | Tax Paid | Tax Assessment Tax Assessment Total Assessment is a certain percentage of the fair market value that is determined by local assessors to be the total taxable value of land and additions on the property. | Land | Improvement |
|---|---|---|---|---|
| 2024 | $1,462 | $41,668 | $2,040 | $39,628 |
| 2023 | $1,390 | $37,468 | $2,040 | $35,428 |
| 2022 | $906 | $24,908 | $1,720 | $23,188 |
| 2021 | $882 | $24,308 | $1,720 | $22,588 |
| 2020 | $827 | $21,940 | $1,565 | $20,375 |
| 2019 | $827 | $21,940 | $1,565 | $20,375 |
| 2018 | $804 | $21,395 | $1,565 | $19,830 |
| 2017 | $862 | $21,395 | $1,565 | $19,830 |
| 2016 | $804 | $21,395 | $1,565 | $19,830 |
| 2015 | $778 | $21,546 | $1,565 | $19,982 |
| 2014 | $778 | $21,546 | $1,565 | $19,982 |
| 2013 | $778 | $20,483 | $1,460 | $19,023 |
Source: Public Records
Map
Nearby Homes
- 118 Morris Dr
- 1109 W 4th Street Extension
- 401 Lee St
- 0 Lake Lure Dr
- 314 W 16th St
- 0 Oriole Rd Unit 160930
- 0 Oriole Rd Unit 23852171
- 0 Oriole Rd Unit 1654653
- 0 Oriole Rd Unit 10543585
- 220 Lake Shore Dr
- 220 Lakeshore Dr
- 907 N Pierce St
- 122 Grace Loop Unit 1
- 118 Grace Loop Unit 1
- 117 Grace Loop Unit 1
- 403 S Ware St
- 0 E 6th St Unit 114222
- 166 Grace Loop Unit 1
- 113 Brite Blue Dr
- 9TH E 417