173 N 400 W Orem, UT 84057
Suncrest Neighborhood
Studio
--
Bath
4,295
Sq Ft
436
Sq Ft Lot
About This Home
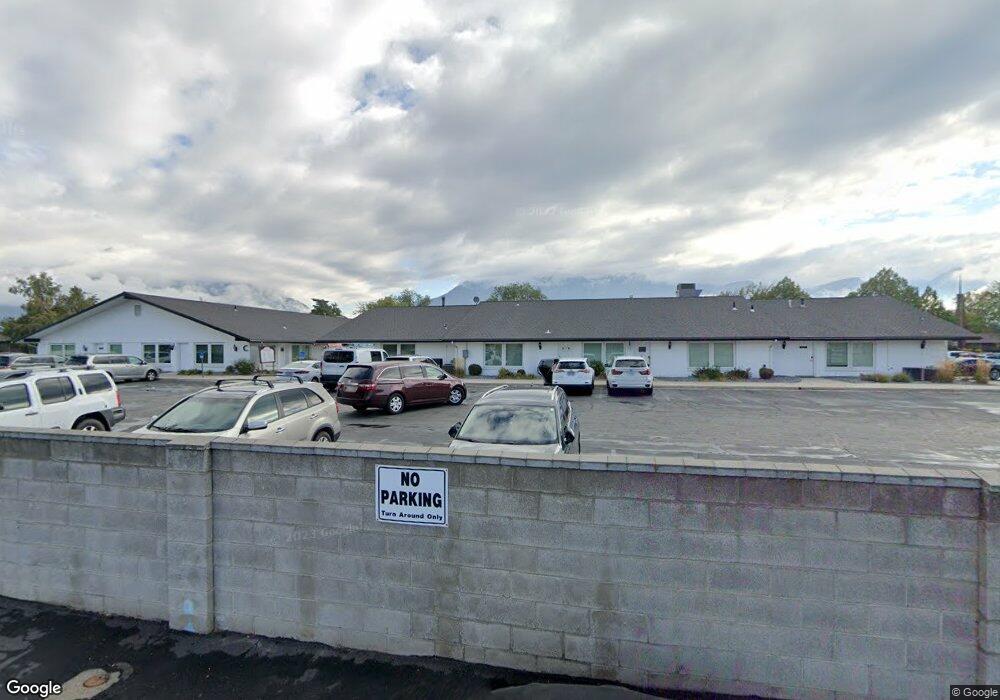
This home is located at 173 N 400 W, Orem, UT 84057. 173 N 400 W is a home located in Utah County with nearby schools including Orem Junior High School, Mountain View High School, and Noah Webster Academy.
Ownership History
Date
Name
Owned For
Owner Type
Purchase Details
Closed on
Dec 1, 2011
Sold by
Berrys Fairies Investment Lc
Bought by
Berrys Fairies Investment Lc
Purchase Details
Closed on
Oct 24, 2011
Sold by
Berrys Fairies Investment Lc
Bought by
Berrys Fairies Investment Lc
Purchase Details
Closed on
Jun 5, 2001
Sold by
Ihc Health Services Inc
Bought by
Caribbean Queen Investment Lc
Home Financials for this Owner
Home Financials are based on the most recent Mortgage that was taken out on this home.
Original Mortgage
$204,000
Interest Rate
7.15%
Mortgage Type
Commercial
Create a Home Valuation Report for This Property
The Home Valuation Report is an in-depth analysis detailing your home's value as well as a comparison with similar homes in the area
Home Values in the Area
Average Home Value in this Area
Purchase History
| Date | Buyer | Sale Price | Title Company |
|---|---|---|---|
| Berrys Fairies Investment Lc | -- | None Available | |
| Berrys Fairies Investment Lc | -- | Juab Title & Abstract Co | |
| Caribbean Queen Investment Lc | -- | Title West Title Co |
Source: Public Records
Mortgage History
| Date | Status | Borrower | Loan Amount |
|---|---|---|---|
| Previous Owner | Caribbean Queen Investment Lc | $204,000 |
Source: Public Records
Tax History
| Year | Tax Paid | Tax Assessment Tax Assessment Total Assessment is a certain percentage of the fair market value that is determined by local assessors to be the total taxable value of land and additions on the property. | Land | Improvement |
|---|---|---|---|---|
| 2025 | $5,146 | $618,900 | $61,300 | $557,600 |
| 2024 | $5,146 | $629,300 | $0 | $0 |
| 2023 | $4,695 | $617,000 | $0 | $0 |
| 2022 | $4,838 | $616,000 | $60,000 | $556,000 |
| 2021 | $3,727 | $395,300 | $60,000 | $335,300 |
| 2020 | $3,792 | $395,300 | $60,000 | $335,300 |
| 2019 | $3,647 | $395,300 | $52,500 | $342,800 |
| 2018 | $3,817 | $395,300 | $52,500 | $342,800 |
| 2017 | $3,919 | $395,300 | $0 | $0 |
| 2016 | $4,249 | $395,300 | $0 | $0 |
| 2015 | $4,493 | $395,300 | $0 | $0 |
| 2014 | $3,511 | $307,500 | $0 | $0 |
Source: Public Records
Map
Nearby Homes
Your Personal Tour Guide
Ask me questions while you tour the home.