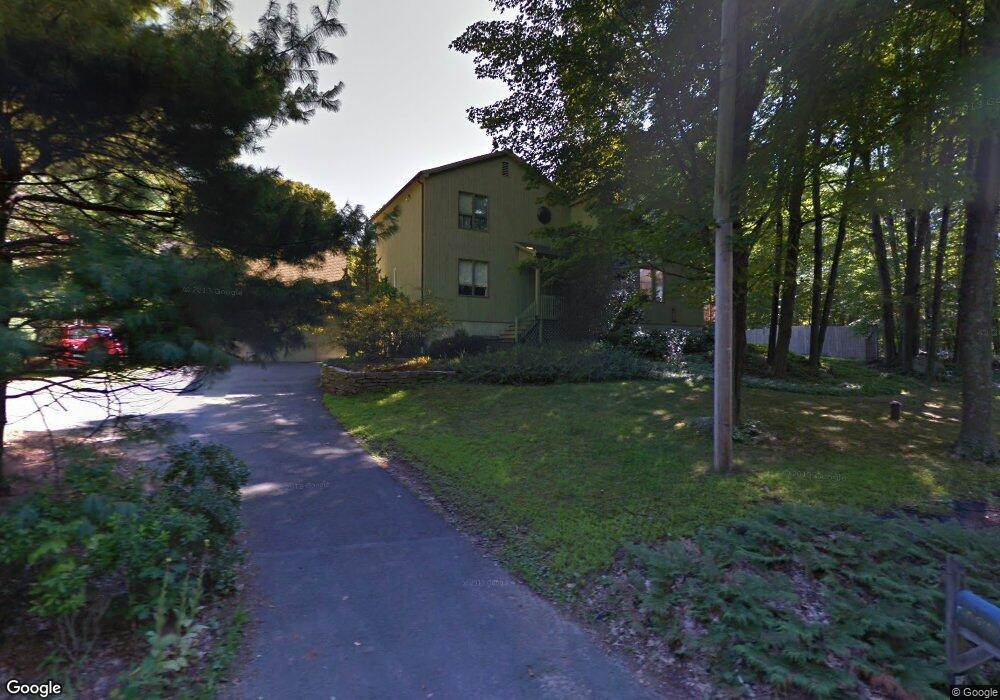
173 Nedobity Rd Higganum, CT 06441
Estimated Value: $462,978 - $580,000
3
Beds
4
Baths
1,774
Sq Ft
$292/Sq Ft
Est. Value
About This Home
This home is located at 173 Nedobity Rd, Higganum, CT 06441 and is currently estimated at $517,245, approximately $291 per square foot. 173 Nedobity Rd is a home located in Middlesex County with nearby schools including Bielefield School.
Ownership History
Date
Name
Owned For
Owner Type
Purchase Details
Closed on
Aug 24, 1998
Sold by
Morasutti Bruno R and Rutter Deborah G
Bought by
Gyorog John M and Mccloskey Molly M
Current Estimated Value
Create a Home Valuation Report for This Property
The Home Valuation Report is an in-depth analysis detailing your home's value as well as a comparison with similar homes in the area
Home Values in the Area
Average Home Value in this Area
Purchase History
| Date | Buyer | Sale Price | Title Company |
|---|---|---|---|
| Gyorog John M | $225,000 | -- |
Source: Public Records
Mortgage History
| Date | Status | Borrower | Loan Amount |
|---|---|---|---|
| Closed | Gyorog John M | $195,000 | |
| Closed | Gyorog John M | $50,000 |
Source: Public Records
Tax History Compared to Growth
Tax History
| Year | Tax Paid | Tax Assessment Tax Assessment Total Assessment is a certain percentage of the fair market value that is determined by local assessors to be the total taxable value of land and additions on the property. | Land | Improvement |
|---|---|---|---|---|
| 2025 | $7,455 | $217,020 | $64,890 | $152,130 |
| 2024 | $7,455 | $217,020 | $64,890 | $152,130 |
| 2023 | $7,350 | $217,020 | $64,890 | $152,130 |
| 2022 | $7,016 | $217,020 | $64,890 | $152,130 |
| 2021 | $6,979 | $217,020 | $64,890 | $152,130 |
| 2020 | $6,827 | $215,430 | $76,690 | $138,740 |
| 2019 | $6,827 | $215,430 | $76,690 | $138,740 |
| 2018 | $6,827 | $215,430 | $76,690 | $138,740 |
| 2017 | $6,827 | $215,430 | $76,690 | $138,740 |
| 2016 | $6,721 | $215,430 | $76,690 | $138,740 |
| 2015 | $6,870 | $220,200 | $76,690 | $143,510 |
| 2014 | $6,802 | $220,200 | $76,690 | $143,510 |
Source: Public Records
Map
Nearby Homes
- 86 Christian Hill Rd
- 32 Maple Ave W
- 0 Mountain Laurel Dr
- 120 Chamberlain Hill Rd
- 215 Chamberlain Hill Rd
- 523 Chamberlain Hill Rd
- 521 Foot Hills Rd
- 955 Chamberlain Hill Rd
- 80 Elizabeth Ln
- 342 Chamberlain Rd
- 0 Walkley Hill Rd Unit 24088136
- 209 Wiese Albert Rd
- 74R Stone Bridge Dr
- 16 Walkley Hill Rd
- 0 S Dish Mill Rd Unit 24082788
- 8 Countryside Ln Unit 2
- 95 Training Hill Rd
- 208 Highmeadow Ln
- 311 E Ridge Rd
- 15 Kent Ct
- 165 Nedobity Rd
- 320 Brainard Hill Rd
- 331 Brainard Hill Rd
- 162 Nedobity Rd
- 315 Brainard Hill Rd
- 308 Brainard Hill Rd
- 340 Brainard Hill Rd
- 319 Brainard Hill Rd
- 347 Brainard Hill Rd
- 153 Nedobity Rd
- 152 Nedobity Rd
- 344 Brainard Hill Rd
- 299 Brainard Hill Rd
- 298 Brainard Hill Rd
- 302 Brainard Hill Rd
- 292 Brainard Hill Rd
- 354 Brainard Hill Rd
- 300 Brainard Hill Rd
- 288 Brainard Hill Rd
- 144 Nedobity Rd