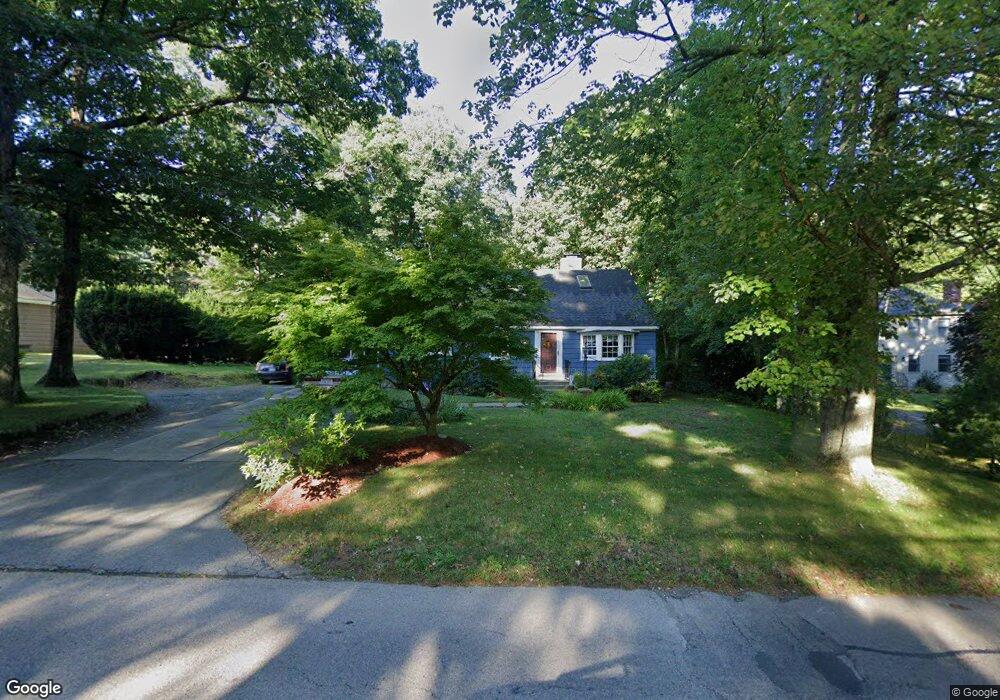
173 Park St Wrentham, MA 02093
Estimated Value: $583,000 - $662,000
2
Beds
2
Baths
1,599
Sq Ft
$380/Sq Ft
Est. Value
About This Home
This home is located at 173 Park St, Wrentham, MA 02093 and is currently estimated at $608,340, approximately $380 per square foot. 173 Park St is a home located in Norfolk County with nearby schools including Delaney Elementary School and Charles E Roderick.
Ownership History
Date
Name
Owned For
Owner Type
Purchase Details
Closed on
Oct 30, 1998
Sold by
Labrie Kevin D
Bought by
Walsh Keith P and Walsh Christine A
Current Estimated Value
Home Financials for this Owner
Home Financials are based on the most recent Mortgage that was taken out on this home.
Original Mortgage
$136,800
Interest Rate
6.68%
Mortgage Type
Purchase Money Mortgage
Purchase Details
Closed on
Dec 3, 1993
Sold by
Calkins Robert A and Calkins Kathleen E
Bought by
Labrie Kevin D and Labrie Tara
Create a Home Valuation Report for This Property
The Home Valuation Report is an in-depth analysis detailing your home's value as well as a comparison with similar homes in the area
Purchase History
| Date | Buyer | Sale Price | Title Company |
|---|---|---|---|
| Walsh Keith P | $171,000 | -- | |
| Labrie Kevin D | $123,000 | -- |
Source: Public Records
Mortgage History
| Date | Status | Borrower | Loan Amount |
|---|---|---|---|
| Open | Labrie Kevin D | $214,400 | |
| Closed | Labrie Kevin D | $22,500 | |
| Closed | Labrie Kevin D | $136,800 |
Source: Public Records
Tax History
| Year | Tax Paid | Tax Assessment Tax Assessment Total Assessment is a certain percentage of the fair market value that is determined by local assessors to be the total taxable value of land and additions on the property. | Land | Improvement |
|---|---|---|---|---|
| 2025 | $6,116 | $527,700 | $273,600 | $254,100 |
| 2024 | $5,906 | $492,200 | $273,600 | $218,600 |
| 2023 | $5,746 | $455,300 | $248,700 | $206,600 |
| 2022 | $5,510 | $403,100 | $232,000 | $171,100 |
| 2021 | $5,136 | $365,000 | $202,500 | $162,500 |
| 2020 | $5,049 | $354,300 | $180,100 | $174,200 |
| 2019 | $4,878 | $345,500 | $180,100 | $165,400 |
| 2018 | $5,378 | $377,700 | $180,200 | $197,500 |
| 2017 | $5,037 | $353,500 | $176,700 | $176,800 |
| 2016 | $4,928 | $345,100 | $171,600 | $173,500 |
| 2015 | $4,780 | $319,100 | $165,000 | $154,100 |
| 2014 | $4,702 | $307,100 | $158,700 | $148,400 |
Source: Public Records
Map
Nearby Homes
- 287 Park St
- 50 Reed Fulton Ave Unit Lot 61
- 500 Franklin St
- 45 Joshua Rd
- 246 Forest Grove Ave
- 9 Elliot Mills Unit 5
- 8 Elliot Mills Unit 30
- 5 Elliot Mills Unit 3
- 7 Elliot Mills Unit 4
- 10 Elliot Mills Unit 29
- 10 Nature View Dr
- 15 Nature View Dr
- 14 Waites Crossing
- 8 Ridgefield Rd
- 75 Jordan Rd
- 19 Waites Crossing
- 13 Waites Crossing
- 0 W Birch Rd
- 2 Earle Stewart Ln
- 12 Earle Stewart Ln
Your Personal Tour Guide
Ask me questions while you tour the home.