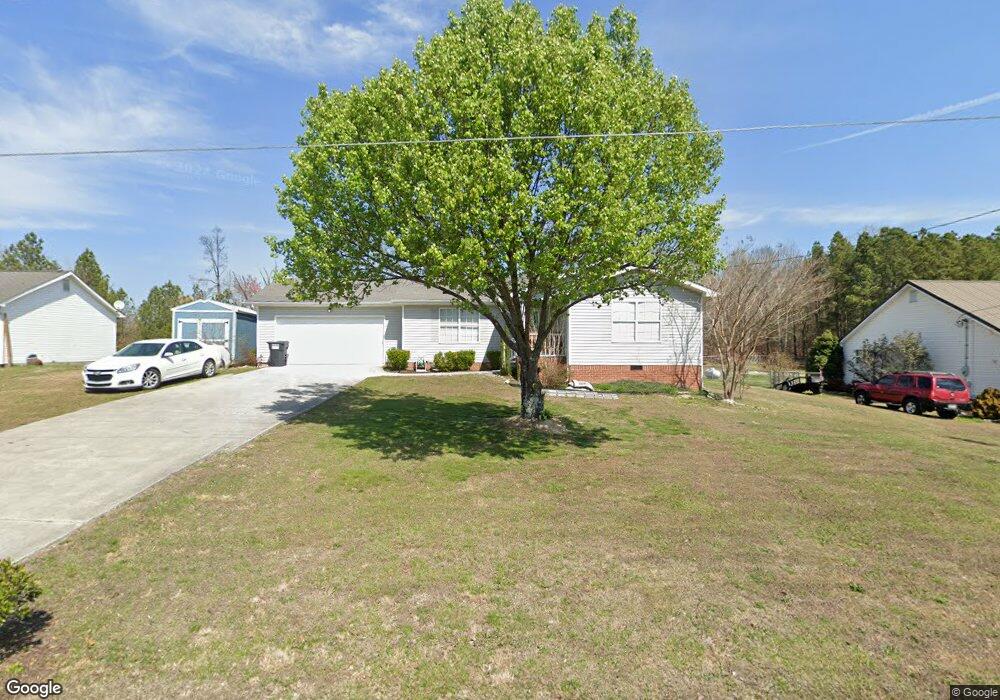
173 Pinewood Dr Rock Spring, GA 30739
Rock Spring NeighborhoodEstimated Value: $236,000 - $262,000
3
Beds
2
Baths
1,230
Sq Ft
$203/Sq Ft
Est. Value
About This Home
This home is located at 173 Pinewood Dr, Rock Spring, GA 30739 and is currently estimated at $249,169, approximately $202 per square foot. 173 Pinewood Dr is a home located in Walker County with nearby schools including Rock Spring Elementary School, Lafayette High School, and Alice M Daley Adventist School.
Ownership History
Date
Name
Owned For
Owner Type
Purchase Details
Closed on
May 14, 2021
Sold by
Greco Austin
Bought by
Ellis Ramona G and Ellis James R
Current Estimated Value
Purchase Details
Closed on
Apr 6, 2020
Sold by
Greco Joseph E
Bought by
Greco Austin
Home Financials for this Owner
Home Financials are based on the most recent Mortgage that was taken out on this home.
Original Mortgage
$136,363
Interest Rate
3.2%
Mortgage Type
New Conventional
Purchase Details
Closed on
Jun 10, 2014
Sold by
Luffman Charlotte Tackett
Bought by
Greco Joseph E and Greco Susan B
Home Financials for this Owner
Home Financials are based on the most recent Mortgage that was taken out on this home.
Original Mortgage
$68,000
Interest Rate
4.23%
Mortgage Type
New Conventional
Purchase Details
Closed on
Jun 26, 2009
Sold by
Sweeten Rodney E
Bought by
Tackett Charlotte
Purchase Details
Closed on
Sep 17, 1999
Sold by
Whitmire John C & Brown Bros
Bought by
Sweeten Rodney S and Sweeten Verna J
Purchase Details
Closed on
Dec 14, 1998
Bought by
Whitmire John C & Brown Bros
Create a Home Valuation Report for This Property
The Home Valuation Report is an in-depth analysis detailing your home's value as well as a comparison with similar homes in the area
Home Values in the Area
Average Home Value in this Area
Purchase History
| Date | Buyer | Sale Price | Title Company |
|---|---|---|---|
| Ellis Ramona G | $162,000 | -- | |
| Greco Austin | $135,000 | -- | |
| Greco Joseph E | $85,000 | -- | |
| Tackett Charlotte | $95,000 | -- | |
| Sweeten Rodney S | $14,000 | -- | |
| Whitmire John C & Brown Bros | -- | -- |
Source: Public Records
Mortgage History
| Date | Status | Borrower | Loan Amount |
|---|---|---|---|
| Previous Owner | Greco Austin | $136,363 | |
| Previous Owner | Greco Joseph E | $68,000 |
Source: Public Records
Tax History Compared to Growth
Tax History
| Year | Tax Paid | Tax Assessment Tax Assessment Total Assessment is a certain percentage of the fair market value that is determined by local assessors to be the total taxable value of land and additions on the property. | Land | Improvement |
|---|---|---|---|---|
| 2024 | $544 | $84,928 | $8,800 | $76,128 |
| 2023 | $487 | $81,120 | $8,800 | $72,320 |
| 2022 | $201 | $74,720 | $8,800 | $65,920 |
| 2021 | $1,511 | $54,650 | $8,800 | $45,850 |
| 2020 | $1,155 | $41,170 | $8,800 | $32,370 |
| 2019 | $1,231 | $41,170 | $8,800 | $32,370 |
| 2018 | $1,089 | $41,170 | $8,800 | $32,370 |
| 2017 | $1,343 | $41,170 | $8,800 | $32,370 |
| 2016 | $1,137 | $41,170 | $8,800 | $32,370 |
| 2015 | $1,016 | $36,350 | $5,000 | $31,350 |
| 2014 | $982 | $36,350 | $5,000 | $31,350 |
| 2013 | -- | $36,350 | $5,000 | $31,350 |
Source: Public Records
Map
Nearby Homes
- 0 Tarvin Rd Unit 1523862
- 533 Van Dell Dr
- 0 Clyde Byrd Rd
- 5062 Georgia 95
- 23 Oak Meadow Dr
- 287 E Teems Rd
- 201 Van Dell Dr
- 58 Oak Run
- 106 Meadow Oak Dr
- 200 Ash Ln
- 1314 Mcintire Rd
- 76 Side Kick Ln
- 524 E Teems Rd
- 1585 E Reed Rd
- 0 Temperance Hall Rd Unit 10506446
- 0 Temperance Hall Rd Unit 1510568
- 0 Cheshire Crossing Dr Unit 1387793
- 1052 Huffman Rd
- 1186 E Reed Rd
- 0 Georgia 95
- 183 Pinewood Dr
- 165 Pinewood Dr
- 153 Pinewood Dr
- 205 Pinewood Dr
- 182 Pinewood Dr
- 158 Pinewood Dr
- 172 Pinewood Dr
- 131 Pinewood Dr
- 196 Pinewood Dr
- 233 Pinewood Dr
- 136 Pinewood Dr
- 216 Pinewood Dr
- 101 Pinewood Dr
- 257 Pinewood Dr
- 116 Pinewood Dr
- 240 Pinewood Dr
- 240 Pinewood Dr Unit 36
- 01 Pinewood Dr
- 81 Pinewood Dr
- 279 Pinewood Dr