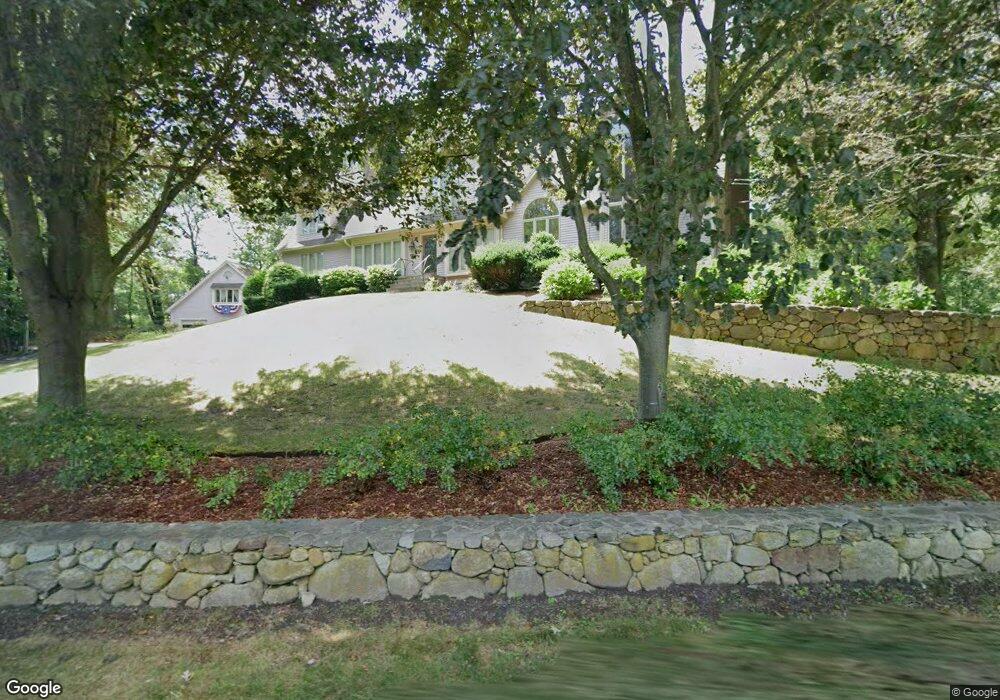
173 Proctor Rd Chelmsford, MA 01824
Park-Proctor NeighborhoodEstimated Value: $1,004,000 - $1,116,000
5
Beds
2
Baths
3,756
Sq Ft
$287/Sq Ft
Est. Value
About This Home
This home is located at 173 Proctor Rd, Chelmsford, MA 01824 and is currently estimated at $1,078,254, approximately $287 per square foot. 173 Proctor Rd is a home located in Middlesex County with nearby schools including South Row Elementary School, McCarthy Middle School, and Chelmsford High School.
Ownership History
Date
Name
Owned For
Owner Type
Purchase Details
Closed on
Jun 19, 2020
Sold by
Zouzas Peter S
Bought by
Zouzas Peter S and Zouzas Dacey
Current Estimated Value
Purchase Details
Closed on
Oct 22, 2010
Sold by
Zouzas Holding Ft and Zouzas Tanya
Bought by
Zouzas Peter S
Home Financials for this Owner
Home Financials are based on the most recent Mortgage that was taken out on this home.
Original Mortgage
$500,000
Interest Rate
4.37%
Mortgage Type
Purchase Money Mortgage
Purchase Details
Closed on
Nov 21, 2006
Sold by
Zouzas Peter S
Bought by
Zouzas Tr Christian and Zouzas Dacey
Create a Home Valuation Report for This Property
The Home Valuation Report is an in-depth analysis detailing your home's value as well as a comparison with similar homes in the area
Home Values in the Area
Average Home Value in this Area
Purchase History
| Date | Buyer | Sale Price | Title Company |
|---|---|---|---|
| Zouzas Peter S | -- | None Available | |
| Zouzas Peter S | -- | -- | |
| Zouzas Tr Christian | -- | -- |
Source: Public Records
Mortgage History
| Date | Status | Borrower | Loan Amount |
|---|---|---|---|
| Previous Owner | Zouzas Peter S | $500,000 |
Source: Public Records
Tax History
| Year | Tax Paid | Tax Assessment Tax Assessment Total Assessment is a certain percentage of the fair market value that is determined by local assessors to be the total taxable value of land and additions on the property. | Land | Improvement |
|---|---|---|---|---|
| 2025 | $14,211 | $1,022,400 | $378,000 | $644,400 |
| 2024 | $13,689 | $1,005,100 | $378,000 | $627,100 |
| 2023 | $12,531 | $872,000 | $384,700 | $487,300 |
| 2022 | $11,985 | $760,000 | $336,800 | $423,200 |
| 2021 | $11,698 | $743,200 | $310,400 | $432,800 |
| 2020 | $11,671 | $709,500 | $277,300 | $432,200 |
| 2019 | $11,239 | $687,400 | $286,000 | $401,400 |
| 2018 | $11,647 | $648,500 | $246,700 | $401,800 |
| 2017 | $11,689 | $652,300 | $232,300 | $420,000 |
| 2016 | $10,270 | $569,600 | $222,600 | $347,000 |
| 2015 | $9,754 | $521,600 | $203,800 | $317,800 |
| 2014 | $9,545 | $502,900 | $197,000 | $305,900 |
Source: Public Records
Map
Nearby Homes
- 12 Martin St
- 24 Algonquin Rd
- 80 Daniels Ln
- 5 Carriage Dr
- 1 Rosemary Ln
- 15 Roberts St
- 235 New Yorker Ave
- 14 Kay's Walk
- 243 Mason Ave
- 209 New Yorker Ave
- 192 Mason Ave
- 262 Littleton Rd Unit 14
- 9 Kay's Walk
- 258 Virginia Farme Ln
- 360 Littleton Rd Unit A4
- 189 Littleton Rd Unit 59
- 31 Aaron Way
- 82 Chestnut Ln
- 9 Acton Rd Unit 6
- 9 Acton Rd Unit 10
Your Personal Tour Guide
Ask me questions while you tour the home.