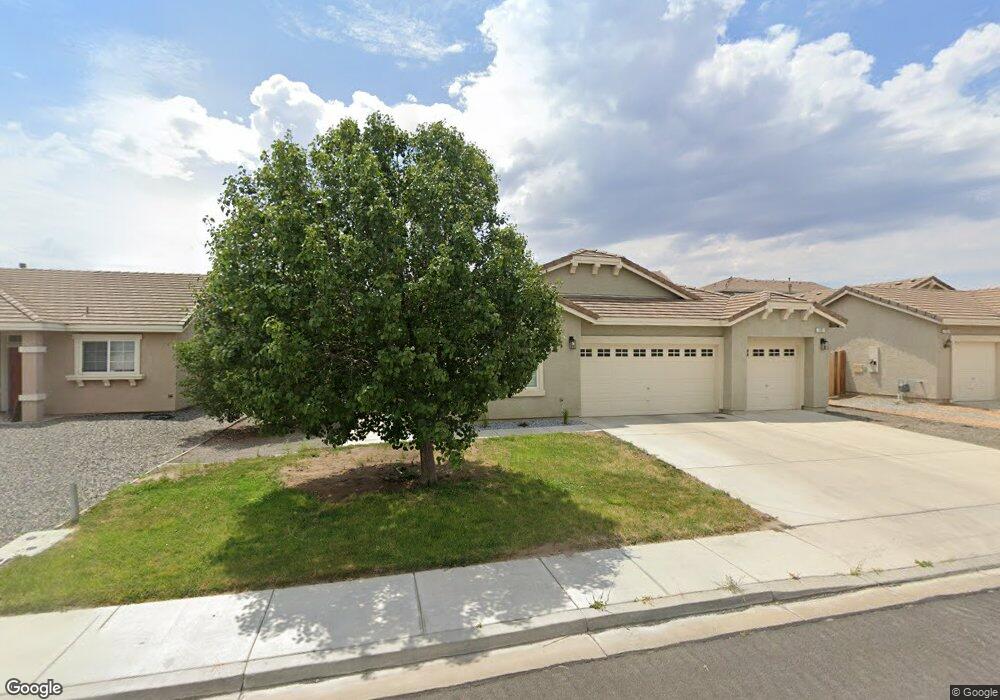
173 Royal Oaks Dr Fernley, NV 89408
Estimated Value: $386,000 - $429,000
3
Beds
2
Baths
1,628
Sq Ft
$247/Sq Ft
Est. Value
About This Home
This home is located at 173 Royal Oaks Dr, Fernley, NV 89408 and is currently estimated at $402,057, approximately $246 per square foot. 173 Royal Oaks Dr is a home located in Lyon County with nearby schools including Fernley Elementary School, Fernley Intermediate School, and Fernley High School.
Ownership History
Date
Name
Owned For
Owner Type
Purchase Details
Closed on
Dec 9, 2021
Sold by
Gleason Robert
Bought by
Gleason Robert and Gleason Sarah J
Current Estimated Value
Home Financials for this Owner
Home Financials are based on the most recent Mortgage that was taken out on this home.
Original Mortgage
$110,000
Outstanding Balance
$86,047
Interest Rate
2.37%
Mortgage Type
New Conventional
Estimated Equity
$316,010
Purchase Details
Closed on
Feb 11, 2009
Sold by
Federal National Mortgage Association
Bought by
Rinker Kyle T and Rinker Sarah J
Home Financials for this Owner
Home Financials are based on the most recent Mortgage that was taken out on this home.
Original Mortgage
$138,775
Interest Rate
4.92%
Mortgage Type
Purchase Money Mortgage
Purchase Details
Closed on
Jun 30, 2008
Sold by
Wackerly Mark T
Bought by
Fannie Mae
Purchase Details
Closed on
Mar 23, 2007
Sold by
R & K Homes Royal Oaks Llc
Bought by
Wackerly Mark T
Home Financials for this Owner
Home Financials are based on the most recent Mortgage that was taken out on this home.
Original Mortgage
$252,379
Interest Rate
6.29%
Mortgage Type
Purchase Money Mortgage
Create a Home Valuation Report for This Property
The Home Valuation Report is an in-depth analysis detailing your home's value as well as a comparison with similar homes in the area
Home Values in the Area
Average Home Value in this Area
Purchase History
| Date | Buyer | Sale Price | Title Company |
|---|---|---|---|
| Gleason Robert | $230,000 | None Available | |
| Rinker Kyle T | $136,000 | Western Title Company Inc | |
| Fannie Mae | $270,750 | Accommodation | |
| Wackerly Mark T | $254,379 | Stewart Title Company |
Source: Public Records
Mortgage History
| Date | Status | Borrower | Loan Amount |
|---|---|---|---|
| Open | Gleason Robert | $110,000 | |
| Previous Owner | Rinker Kyle T | $138,775 | |
| Previous Owner | Wackerly Mark T | $252,379 |
Source: Public Records
Tax History Compared to Growth
Tax History
| Year | Tax Paid | Tax Assessment Tax Assessment Total Assessment is a certain percentage of the fair market value that is determined by local assessors to be the total taxable value of land and additions on the property. | Land | Improvement |
|---|---|---|---|---|
| 2025 | $1,831 | $117,263 | $42,000 | $75,263 |
| 2024 | $2,187 | $117,628 | $42,000 | $75,628 |
| 2023 | $2,187 | $112,784 | $42,000 | $70,784 |
| 2022 | $2,057 | $107,099 | $42,000 | $65,099 |
| 2021 | $2,034 | $91,403 | $28,000 | $63,403 |
| 2020 | $1,982 | $88,858 | $28,000 | $60,858 |
| 2019 | $1,952 | $86,591 | $28,000 | $58,591 |
| 2018 | $1,911 | $81,632 | $24,500 | $57,132 |
| 2017 | $1,901 | $72,122 | $15,050 | $57,072 |
| 2016 | $1,707 | $55,181 | $5,780 | $49,401 |
| 2015 | $1,742 | $42,565 | $5,780 | $36,785 |
| 2014 | $1,702 | $39,405 | $5,780 | $33,625 |
Source: Public Records
Map
Nearby Homes
- 1720 Blue Oak Ct
- 1715 Short Oak Ct
- 242 Red Oak Dr
- 234 Red Oak Dr
- 180 Walnut Dr
- 610 Desert Shadows Ln
- 1453 Grey Bluffs Dr
- 1394 Red Bluff Way Unit 1
- 113-123 Sario Dr
- 910 Desert Shadows Ln
- 21 Valley View Dr
- 13 Valley View Dr
- 785 Garnet Way
- 270 Elm St
- 6405 Highway 95a Unit 247
- 8350 Highway 95a
- 3690 Highway 95a
- 3670 Highway 95a
- 5460 Highway 95a
- 3565 Highway 95a
- 175 Royal Oaks Dr Unit 3
- 171 Royal Oaks Dr
- 1721 Blue Oak Ct
- 169 Royal Oaks Dr
- 177 Royal Oaks Dr
- 1712 Short Oak Ct
- 172 Royal Oaks Dr
- 1710 Short Oak Ct
- 170 Royal Oaks Dr
- 250 Red Oak Dr
- 179 Royal Oaks Dr
- 167 Royal Oaks Dr
- 1725 Blue Oak Ct
- 1722 Blue Oak Ct
- 1714 Short Oak Ct
- 248 Red Oaks Dr
- 1711 Short Oak Ct
- 165 Royal Oaks Dr
- 1724 Blue Oak Ct
- 1713 Oak Dr