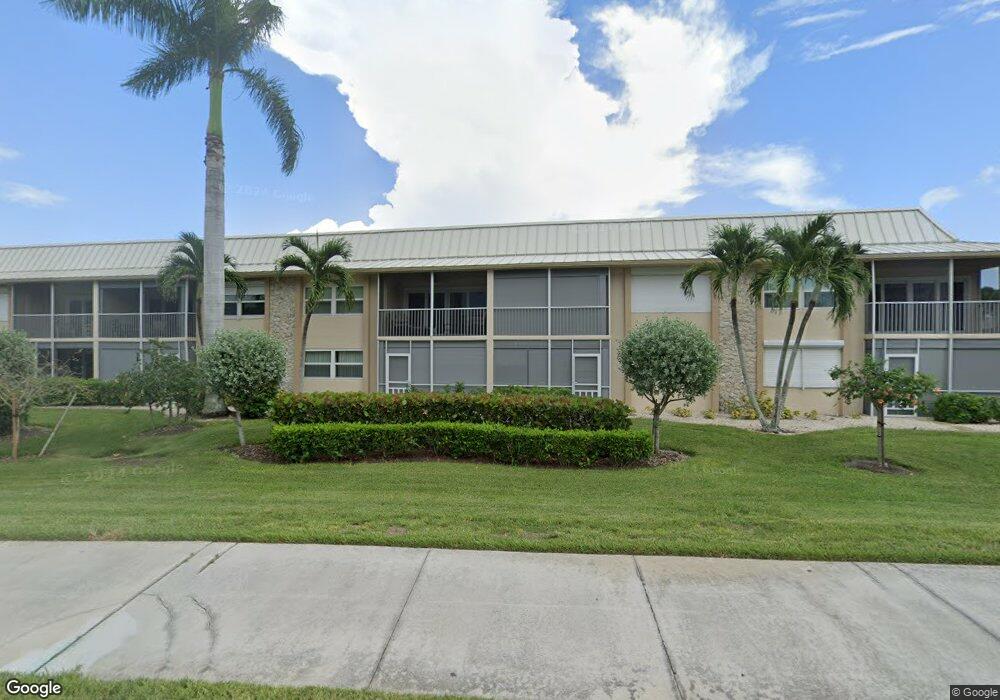
173 S Collier Blvd Unit G103 Marco Island, FL 34145
Estimated Value: $467,037 - $778,000
2
Beds
2
Baths
1,184
Sq Ft
$498/Sq Ft
Est. Value
About This Home
This home is located at 173 S Collier Blvd Unit G103, Marco Island, FL 34145 and is currently estimated at $589,759, approximately $498 per square foot. 173 S Collier Blvd Unit G103 is a home located in Collier County with nearby schools including Tommie Barfield Elementary School, Manatee Middle School, and Lely High School.
Ownership History
Date
Name
Owned For
Owner Type
Purchase Details
Closed on
Nov 20, 2019
Sold by
Rozell David H and Rozell Darlene D
Bought by
Mitzen Lisa A
Current Estimated Value
Purchase Details
Closed on
Sep 14, 2017
Sold by
Rozell David H and Rozell Darlene D
Bought by
Rozell David H and Rozell Darlene D
Purchase Details
Closed on
Oct 13, 2016
Sold by
Mitzen Lisa A and Rozell Lisa A
Bought by
Mitzen Lisa A
Purchase Details
Closed on
Aug 2, 2004
Sold by
Cushing William T and Cushing Barbara E
Bought by
Rozell David and Rozell Darlene
Home Financials for this Owner
Home Financials are based on the most recent Mortgage that was taken out on this home.
Original Mortgage
$250,000
Outstanding Balance
$129,039
Interest Rate
6.62%
Mortgage Type
New Conventional
Estimated Equity
$460,720
Create a Home Valuation Report for This Property
The Home Valuation Report is an in-depth analysis detailing your home's value as well as a comparison with similar homes in the area
Home Values in the Area
Average Home Value in this Area
Purchase History
| Date | Buyer | Sale Price | Title Company |
|---|---|---|---|
| Mitzen Lisa A | -- | Attorney | |
| Rozell David H | -- | Attorney | |
| Rozell David H | -- | Attorney | |
| Mitzen Lisa A | -- | None Available | |
| Rozell David | $350,000 | Marco Title Services Inc |
Source: Public Records
Mortgage History
| Date | Status | Borrower | Loan Amount |
|---|---|---|---|
| Open | Rozell David | $250,000 |
Source: Public Records
Tax History Compared to Growth
Tax History
| Year | Tax Paid | Tax Assessment Tax Assessment Total Assessment is a certain percentage of the fair market value that is determined by local assessors to be the total taxable value of land and additions on the property. | Land | Improvement |
|---|---|---|---|---|
| 2025 | $3,840 | $410,839 | -- | -- |
| 2024 | $3,766 | $373,490 | -- | -- |
| 2023 | $3,766 | $339,536 | $0 | $0 |
| 2022 | $3,495 | $308,669 | $0 | $0 |
| 2021 | $3,036 | $280,608 | $0 | $280,608 |
| 2020 | $3,020 | $280,608 | $0 | $280,608 |
| 2019 | $2,986 | $272,320 | $0 | $272,320 |
| 2018 | $2,850 | $259,296 | $0 | $259,296 |
| 2017 | $2,887 | $252,225 | $0 | $0 |
| 2016 | $2,663 | $229,295 | $0 | $0 |
| 2015 | $2,437 | $208,450 | $0 | $0 |
| 2014 | $2,224 | $189,500 | $0 | $0 |
Source: Public Records
Map
Nearby Homes
- 207 S Collier Blvd Unit 4-105
- 207 S Collier Blvd Unit 4-208
- 176 S Collier Blvd Unit 1205
- 176 S Collier Blvd Unit 607
- 176 S Collier Blvd Unit 101
- 176 S Collier Blvd Unit 1105
- 176 S Collier Blvd Unit 1107
- 176 S Collier Blvd Unit 906
- 174 S Collier Blvd Unit PH-D
- 174 S Collier Blvd Unit 904
- 174 S Collier Blvd Unit 304
- 173 S Collier Blvd Unit 203
- 173 S Collier Blvd
- 173 S Collier Blvd
- 173 S Collier Blvd
- 173 S Collier Blvd
- 173 S Collier Blvd
- 173 S Collier Blvd
- 173 S Collier Blvd
- 173 S Collier Blvd
- 173 S Collier Blvd Unit G101
- 173 S Collier Blvd Unit 105
- 173 S Collier Blvd
- 173 S Collier Blvd Unit G-204
- 169 S Collier Blvd Unit H-104
- 169 S Collier Blvd
- 169 S Collier Blvd
- 169 S Collier Blvd
- 169 S Collier Blvd Unit H202
- 169 S Collier Blvd Unit H201
- 169 S Collier Blvd Unit 106