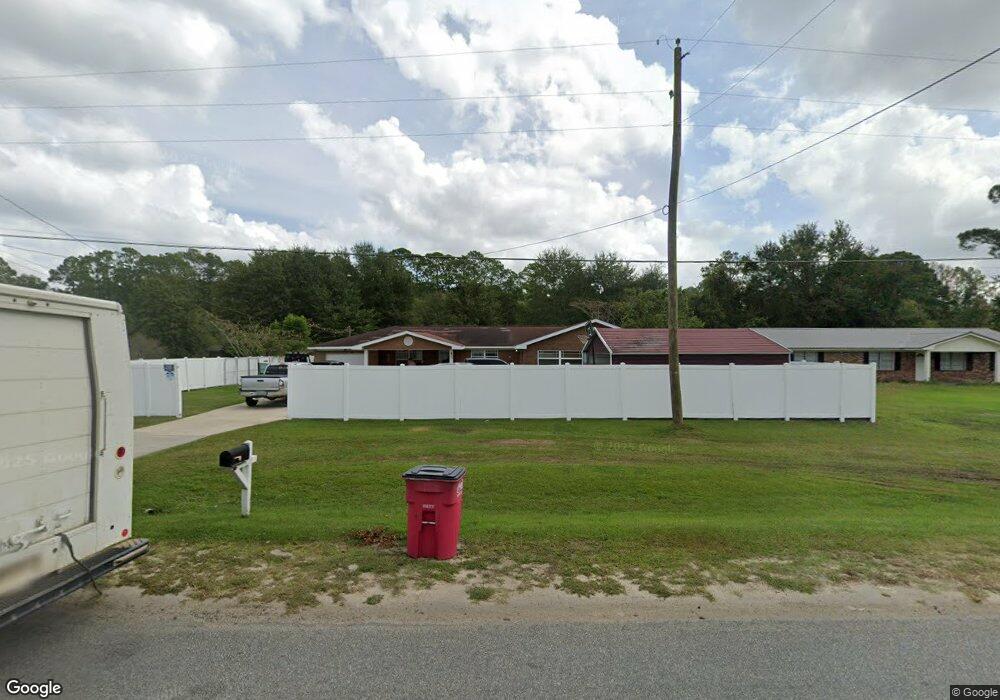
173 S Cromartie St Hazlehurst, GA 31539
Estimated Value: $186,789 - $221,000
3
Beds
3
Baths
2,087
Sq Ft
$96/Sq Ft
Est. Value
About This Home
This home is located at 173 S Cromartie St, Hazlehurst, GA 31539 and is currently estimated at $200,947, approximately $96 per square foot. 173 S Cromartie St is a home located in Jeff Davis County with nearby schools including Jeff Davis Primary School, Jeff Davis Elementary School, and Jeff Davis Middle School.
Ownership History
Date
Name
Owned For
Owner Type
Purchase Details
Closed on
Dec 13, 2021
Sold by
Patel Meridith
Bought by
Harrell Sabrina
Current Estimated Value
Home Financials for this Owner
Home Financials are based on the most recent Mortgage that was taken out on this home.
Original Mortgage
$147,283
Outstanding Balance
$135,224
Interest Rate
2.98%
Mortgage Type
FHA
Estimated Equity
$65,723
Purchase Details
Closed on
Mar 20, 2009
Sold by
Spoon John D
Bought by
Patel Meridith
Home Financials for this Owner
Home Financials are based on the most recent Mortgage that was taken out on this home.
Original Mortgage
$20,232
Interest Rate
5.1%
Mortgage Type
Future Advance Clause Open End Mortgage
Purchase Details
Closed on
May 20, 2003
Sold by
Spoon Daisy Kight
Bought by
Spoon John D
Purchase Details
Closed on
Nov 5, 1998
Bought by
Spoon Daisy Kight
Purchase Details
Closed on
Jan 1, 1972
Bought by
Spoon J D
Create a Home Valuation Report for This Property
The Home Valuation Report is an in-depth analysis detailing your home's value as well as a comparison with similar homes in the area
Home Values in the Area
Average Home Value in this Area
Purchase History
| Date | Buyer | Sale Price | Title Company |
|---|---|---|---|
| Harrell Sabrina | $150,000 | -- | |
| Patel Meridith | $25,000 | -- | |
| Spoon John D | -- | -- | |
| Spoon Daisy Kight | -- | -- | |
| Spoon J D | -- | -- |
Source: Public Records
Mortgage History
| Date | Status | Borrower | Loan Amount |
|---|---|---|---|
| Open | Harrell Sabrina | $147,283 | |
| Previous Owner | Patel Meridith | $20,232 |
Source: Public Records
Tax History Compared to Growth
Tax History
| Year | Tax Paid | Tax Assessment Tax Assessment Total Assessment is a certain percentage of the fair market value that is determined by local assessors to be the total taxable value of land and additions on the property. | Land | Improvement |
|---|---|---|---|---|
| 2024 | $2,741 | $73,320 | $1,600 | $71,720 |
| 2023 | $1,782 | $47,679 | $1,600 | $46,079 |
| 2022 | $1,782 | $47,679 | $1,600 | $46,079 |
| 2021 | $1,723 | $47,679 | $1,600 | $46,079 |
| 2020 | $1,782 | $47,679 | $1,600 | $46,079 |
| 2019 | $1,801 | $48,170 | $1,600 | $46,570 |
| 2018 | $1,801 | $48,170 | $1,600 | $46,570 |
| 2017 | $1,315 | $47,540 | $2,000 | $45,540 |
| 2016 | $1,206 | $44,483 | $2,000 | $42,483 |
| 2015 | -- | $44,483 | $2,000 | $42,483 |
| 2014 | -- | $45,068 | $2,000 | $43,068 |
Source: Public Records
Map
Nearby Homes
- 0 Educational Dr
- 00 Pat Dixon St & Charles Rogers Blvd
- 58 Currie St
- 54 Walton Way
- 0 Charles Rogers Blvd
- 73 Latimer St
- 44 Kersey St
- 20 W Sycamore St
- 53 Mockingbird Ln
- 39 N Tallahassee St
- 0 Wragler Ln Unit 10542405
- 0 Tallahassee St Unit 10554247
- 21 Pine St
- 102 W Palm Rd
- 4 Lakeside Dr
- 19 Martin Luther King jr Blvd
- 95 E Plum St
- 17 Young St
- 104 N Tallahassee St
- 134 1st Rd
- 177 S Cromartie St
- 26 Bellview Cir
- 181 S Cromartie St
- 165 S Cromartie St
- 38 Bellview Cir
- 22 Bellview Cir
- 180 S Cromartie St
- 185 S Cromartie St
- 42 Bellview Cir
- 157 S Cromartie St
- 203 Hester St
- 16 Bellview Cir
- 29 Bellview Cir
- 23 Hester St
- 33 Hester St
- 187 S Cromartie St
- 188 S Cromartie St
- 37 Hester St
- 17 Bellview Cir
- 43 Bellview Cir