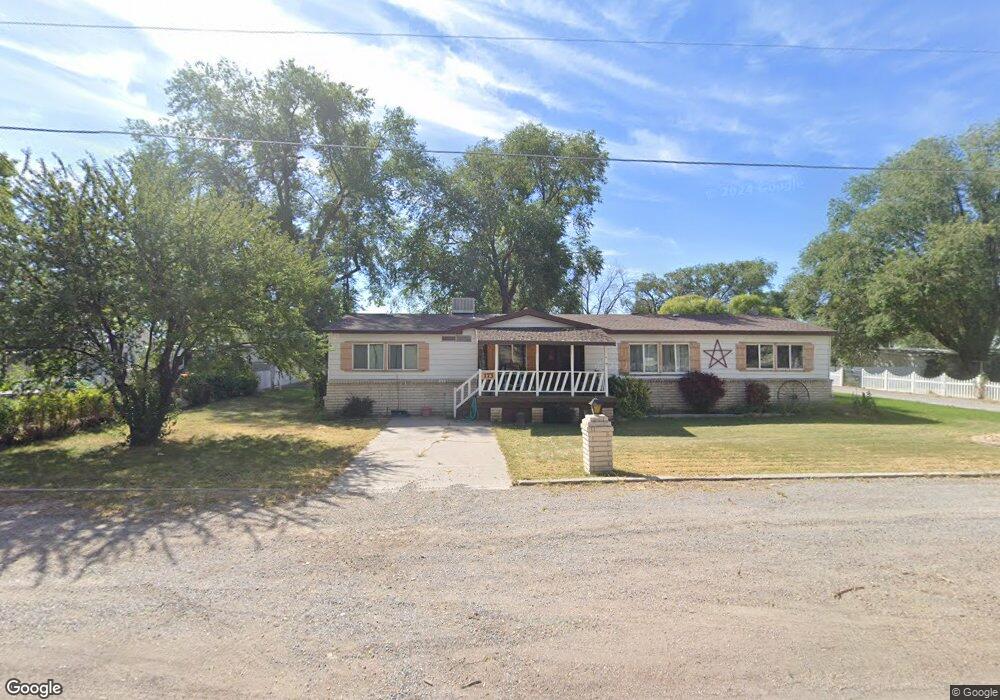
173 W Center St Hinckley, UT 84635
Estimated Value: $193,000 - $253,841
3
Beds
2
Baths
1,876
Sq Ft
$114/Sq Ft
Est. Value
About This Home
This home is located at 173 W Center St, Hinckley, UT 84635 and is currently estimated at $214,460, approximately $114 per square foot. 173 W Center St is a home located in Millard County.
Ownership History
Date
Name
Owned For
Owner Type
Purchase Details
Closed on
Jul 17, 2020
Sold by
Talbot Carol Dean and Millard Hinckley
Bought by
Bayles Kurt
Current Estimated Value
Purchase Details
Closed on
Oct 24, 2012
Sold by
Town Of Hinckley
Bought by
Talbot Carol Dean
Purchase Details
Closed on
Feb 23, 2006
Sold by
Talbot Carol Dean and Dean Talbot H
Bought by
Talbot Carol Dean
Create a Home Valuation Report for This Property
The Home Valuation Report is an in-depth analysis detailing your home's value as well as a comparison with similar homes in the area
Home Values in the Area
Average Home Value in this Area
Purchase History
| Date | Buyer | Sale Price | Title Company |
|---|---|---|---|
| Bayles Kurt | -- | None Available | |
| Talbot Carol Dean | -- | -- | |
| Talbot Carol Dean | -- | -- |
Source: Public Records
Tax History Compared to Growth
Tax History
| Year | Tax Paid | Tax Assessment Tax Assessment Total Assessment is a certain percentage of the fair market value that is determined by local assessors to be the total taxable value of land and additions on the property. | Land | Improvement |
|---|---|---|---|---|
| 2025 | $969 | $115,462 | $15,824 | $99,638 |
| 2024 | $969 | $88,773 | $5,946 | $82,827 |
| 2023 | $1,061 | $88,773 | $5,946 | $82,827 |
| 2022 | $838 | $70,839 | $5,405 | $65,434 |
| 2021 | $616 | $49,618 | $4,505 | $45,113 |
| 2020 | $500 | $40,279 | $4,290 | $35,989 |
| 2019 | $3 | $40,279 | $4,290 | $35,989 |
| 2018 | $3 | $40,279 | $4,290 | $35,989 |
| 2017 | $3 | $40,279 | $4,290 | $35,989 |
| 2016 | $3 | $40,279 | $4,290 | $35,989 |
| 2015 | $3 | $47,747 | $4,290 | $43,457 |
| 2014 | -- | $47,747 | $4,290 | $43,457 |
| 2013 | -- | $46,482 | $4,290 | $42,192 |
Source: Public Records
Map
Nearby Homes
- 289 W Center St S
- 168 N 100 Rd W
- 6500 W 2000 S
- 1040 W Center St
- 700 Acres
- 1500 S 10000 W
- 6000 N 10000 W
- 700 Acres Hwy 6 & Main St (Hwy 50)
- 2000 E 10500 N
- 6200 S 3000 W
- 3480 S 4000 W
- 3770 S 4000 Rd W
- 0 Tbd 3000 Rd S Unit LotWP001
- 6177 S 3000 Rd W
- 3885 W 4500 S
- 17000 W 2500 Rd S
- 16700 W 2500 South Rd
- 16800 W 2500 South Rd
- 470 S 2750 W Unit 6
- 460 S 2750 W Unit 7