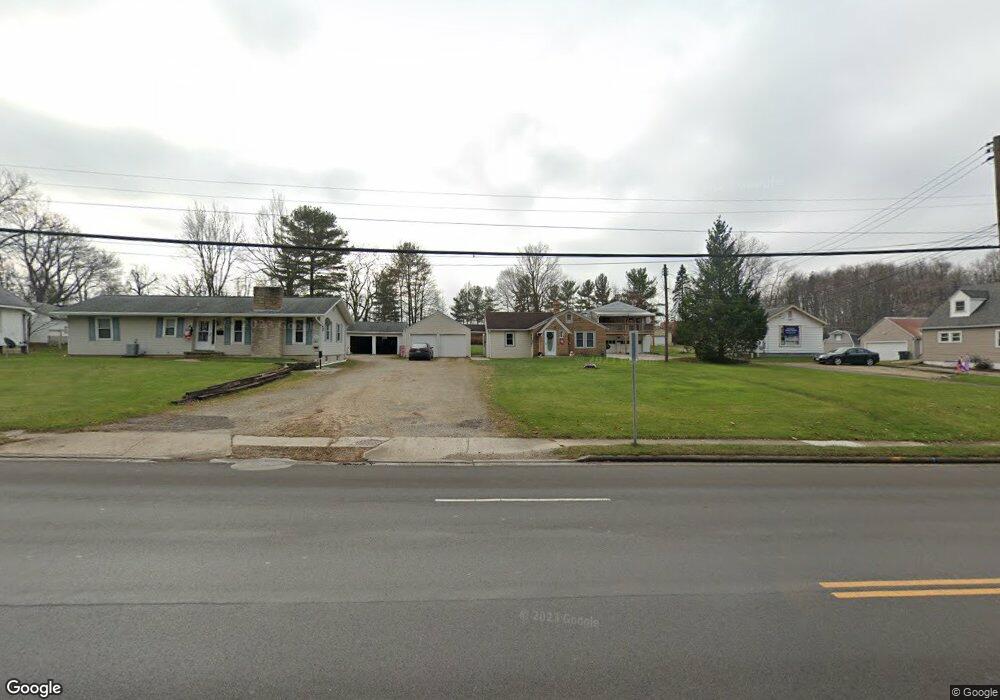
173 W Cook Rd Mansfield, OH 44907
Estimated Value: $94,000 - $138,000
2
Beds
1
Bath
992
Sq Ft
$114/Sq Ft
Est. Value
About This Home
This home is located at 173 W Cook Rd, Mansfield, OH 44907 and is currently estimated at $113,021, approximately $113 per square foot. 173 W Cook Rd is a home located in Richland County with nearby schools including Madison High School, Mansfield Christian School, and St. Peter's Elementary/Montessori School.
Ownership History
Date
Name
Owned For
Owner Type
Purchase Details
Closed on
Jun 2, 2017
Sold by
Cress David George and The William R & Mary Jane Cres
Bought by
Miller Darrell J
Current Estimated Value
Purchase Details
Closed on
Jan 4, 2013
Sold by
Advantage Credit Union Inc
Bought by
Cress David George
Purchase Details
Closed on
Nov 17, 2010
Sold by
Kempton Jeffrey A
Bought by
Advantage Credit Union Inc
Purchase Details
Closed on
Nov 8, 2002
Sold by
Eagleston Donna L
Bought by
Kempton Jeffrey
Home Financials for this Owner
Home Financials are based on the most recent Mortgage that was taken out on this home.
Original Mortgage
$52,000
Interest Rate
5.51%
Mortgage Type
New Conventional
Purchase Details
Closed on
Jul 1, 2001
Sold by
Eagleston Donna L
Bought by
Kempton Jeffrey A
Purchase Details
Closed on
Feb 1, 1985
Create a Home Valuation Report for This Property
The Home Valuation Report is an in-depth analysis detailing your home's value as well as a comparison with similar homes in the area
Home Values in the Area
Average Home Value in this Area
Purchase History
| Date | Buyer | Sale Price | Title Company |
|---|---|---|---|
| Miller Darrell J | $37,000 | Chicago Title | |
| Cress David George | $40,000 | Chicago Title | |
| Advantage Credit Union Inc | $24,000 | Attorney | |
| Kempton Jeffrey | $52,000 | -- | |
| Kempton Jeffrey A | $49,000 | -- | |
| -- | $29,000 | -- |
Source: Public Records
Mortgage History
| Date | Status | Borrower | Loan Amount |
|---|---|---|---|
| Previous Owner | Kempton Jeffrey | $52,000 |
Source: Public Records
Tax History Compared to Growth
Tax History
| Year | Tax Paid | Tax Assessment Tax Assessment Total Assessment is a certain percentage of the fair market value that is determined by local assessors to be the total taxable value of land and additions on the property. | Land | Improvement |
|---|---|---|---|---|
| 2024 | $776 | $18,780 | $5,470 | $13,310 |
| 2023 | $776 | $18,780 | $5,470 | $13,310 |
| 2022 | $676 | $15,070 | $4,890 | $10,180 |
| 2021 | $676 | $15,070 | $4,890 | $10,180 |
| 2020 | $683 | $15,070 | $4,890 | $10,180 |
| 2019 | $651 | $12,970 | $4,140 | $8,830 |
| 2018 | $645 | $12,970 | $4,140 | $8,830 |
| 2017 | $871 | $17,880 | $4,360 | $13,520 |
| 2016 | $665 | $13,330 | $4,140 | $9,190 |
| 2015 | $653 | $13,330 | $4,140 | $9,190 |
| 2014 | $650 | $13,330 | $4,140 | $9,190 |
| 2012 | $754 | $18,210 | $4,360 | $13,850 |
Source: Public Records
Map
Nearby Homes
- 136 Elmridge Rd
- 33 Rambleside Dr
- 61 Ridgewood Blvd
- 1156 Yorkwood Rd
- 674 Hillgrove Ave
- 681 Hillgrove Ave
- 0 S Main St
- 181 Chilton Ave
- 0 Lexington Ave Unit 224009661
- 0 George Ave
- 1156 Briarwood Rd
- 421 Edgewood Rd
- 476 Glendale Blvd
- 501 Clifton Blvd
- 431 Overlook Rd
- 69 Reba Ave
- 844 Woodville Rd
- 189 Kinkel Ave
- 237 Willowbrook Dr
- 505 Wood St