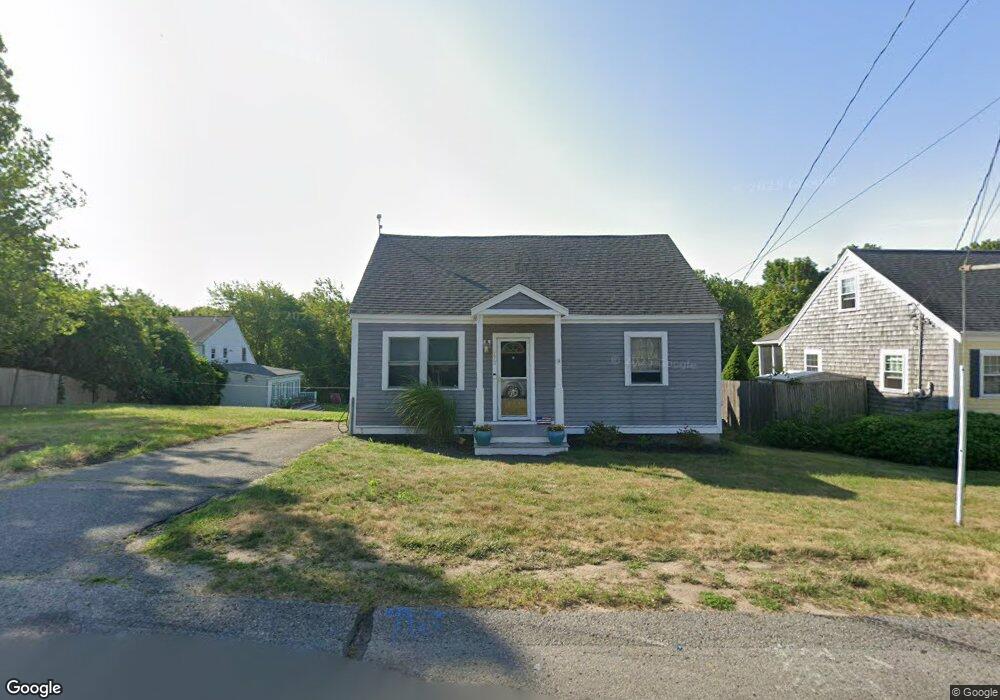
173 Webster Ave Marshfield, MA 02050
Ocean Bluff-Brant Rock NeighborhoodEstimated Value: $591,779 - $711,000
4
Beds
1
Bath
1,468
Sq Ft
$453/Sq Ft
Est. Value
About This Home
This home is located at 173 Webster Ave, Marshfield, MA 02050 and is currently estimated at $664,445, approximately $452 per square foot. 173 Webster Ave is a home located in Plymouth County with nearby schools including Governor Edward Winslow School, Furnace Brook Middle School, and Marshfield High School.
Ownership History
Date
Name
Owned For
Owner Type
Purchase Details
Closed on
Sep 12, 2003
Sold by
Lee Marsha A
Bought by
Ayre Michael D and Ayre Kristen L
Current Estimated Value
Purchase Details
Closed on
Feb 28, 2003
Sold by
Hall Deborah J and Hall Gregory A
Bought by
Lee Marsha A and Farrell John J
Purchase Details
Closed on
Aug 29, 2000
Sold by
Mcdonough Mary E Est
Bought by
Hall Deborah J and Hall Gregory A
Purchase Details
Closed on
Oct 5, 1998
Sold by
Cobb Kevin M and Cobb Paula F
Bought by
Mcdonough Mary E
Purchase Details
Closed on
Nov 8, 1996
Sold by
Ford Thomas P and Ford Barbara G
Bought by
Cobb Kevin M and Cobb Paula F
Create a Home Valuation Report for This Property
The Home Valuation Report is an in-depth analysis detailing your home's value as well as a comparison with similar homes in the area
Home Values in the Area
Average Home Value in this Area
Purchase History
| Date | Buyer | Sale Price | Title Company |
|---|---|---|---|
| Ayre Michael D | $313,100 | -- | |
| Ayre Michael D | $313,100 | -- | |
| Lee Marsha A | $287,000 | -- | |
| Lee Marsha A | $287,000 | -- | |
| Hall Deborah J | $200,000 | -- | |
| Hall Deborah J | $200,000 | -- | |
| Mcdonough Mary E | $156,000 | -- | |
| Mcdonough Mary E | $156,000 | -- | |
| Cobb Kevin M | $143,500 | -- | |
| Cobb Kevin M | $143,500 | -- |
Source: Public Records
Mortgage History
| Date | Status | Borrower | Loan Amount |
|---|---|---|---|
| Open | Cobb Kevin M | $86,000 |
Source: Public Records
Tax History
| Year | Tax Paid | Tax Assessment Tax Assessment Total Assessment is a certain percentage of the fair market value that is determined by local assessors to be the total taxable value of land and additions on the property. | Land | Improvement |
|---|---|---|---|---|
| 2025 | $5,513 | $556,900 | $317,600 | $239,300 |
| 2024 | $5,360 | $515,900 | $297,800 | $218,100 |
| 2023 | $5,047 | $457,600 | $268,000 | $189,600 |
| 2022 | $5,047 | $389,700 | $228,300 | $161,400 |
| 2021 | $4,766 | $361,300 | $218,400 | $142,900 |
| 2020 | $4,419 | $331,500 | $188,600 | $142,900 |
| 2019 | $4,303 | $321,600 | $188,600 | $133,000 |
| 2018 | $4,205 | $314,500 | $188,600 | $125,900 |
| 2017 | $3,935 | $286,800 | $178,700 | $108,100 |
| 2016 | $3,763 | $271,100 | $168,700 | $102,400 |
| 2015 | $3,603 | $271,100 | $168,700 | $102,400 |
| 2014 | $3,509 | $264,000 | $168,700 | $95,300 |
Source: Public Records
Map
Nearby Homes
Your Personal Tour Guide
Ask me questions while you tour the home.