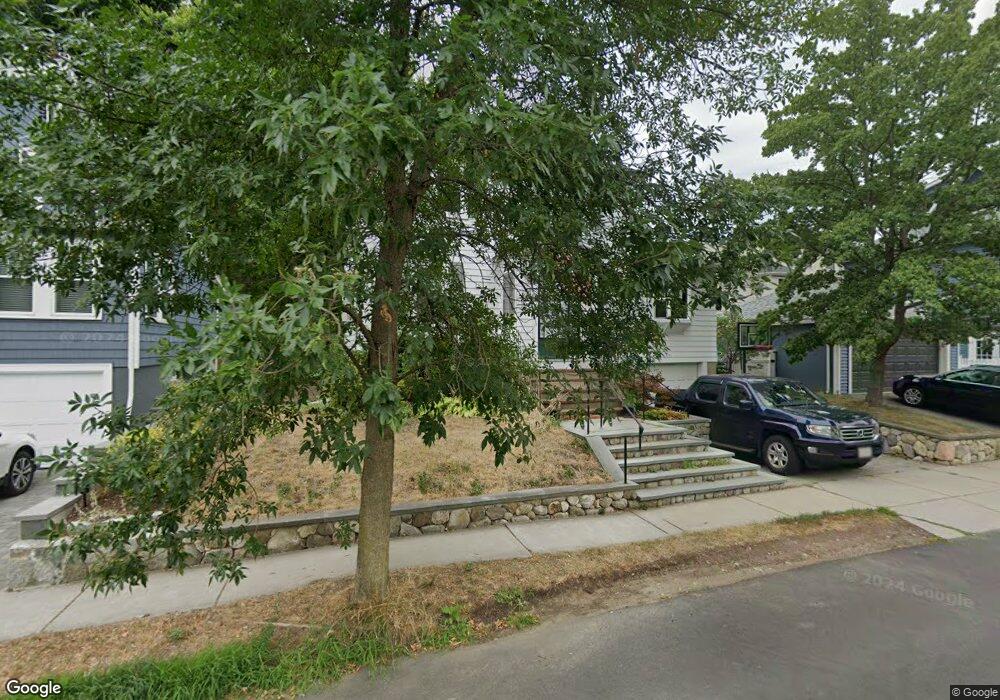
173 Worcester St Watertown, MA 02472
West Watertown NeighborhoodEstimated Value: $874,000 - $897,000
3
Beds
2
Baths
1,470
Sq Ft
$603/Sq Ft
Est. Value
About This Home
This home is located at 173 Worcester St, Watertown, MA 02472 and is currently estimated at $885,820, approximately $602 per square foot. 173 Worcester St is a home located in Middlesex County with nearby schools including The Kendall School and Beacon High School.
Ownership History
Date
Name
Owned For
Owner Type
Purchase Details
Closed on
Jun 24, 1992
Sold by
Brown Ian W and Lambert-Brown Nancy
Bought by
Howe Brian M and Howe Maryellen F
Current Estimated Value
Home Financials for this Owner
Home Financials are based on the most recent Mortgage that was taken out on this home.
Original Mortgage
$128,850
Interest Rate
8.57%
Mortgage Type
Purchase Money Mortgage
Create a Home Valuation Report for This Property
The Home Valuation Report is an in-depth analysis detailing your home's value as well as a comparison with similar homes in the area
Home Values in the Area
Average Home Value in this Area
Purchase History
| Date | Buyer | Sale Price | Title Company |
|---|---|---|---|
| Howe Brian M | $161,000 | -- | |
| Howe Brian M | $161,000 | -- |
Source: Public Records
Mortgage History
| Date | Status | Borrower | Loan Amount |
|---|---|---|---|
| Open | Howe Brian M | $110,500 | |
| Closed | Howe Brian M | $128,850 | |
| Previous Owner | Howe Brian M | $147,000 |
Source: Public Records
Tax History Compared to Growth
Tax History
| Year | Tax Paid | Tax Assessment Tax Assessment Total Assessment is a certain percentage of the fair market value that is determined by local assessors to be the total taxable value of land and additions on the property. | Land | Improvement |
|---|---|---|---|---|
| 2025 | $9,707 | $831,100 | $520,300 | $310,800 |
| 2024 | $8,962 | $766,000 | $491,600 | $274,400 |
| 2023 | $9,790 | $720,900 | $470,300 | $250,600 |
| 2022 | $8,872 | $669,600 | $427,500 | $242,100 |
| 2021 | $8,029 | $655,400 | $413,300 | $242,100 |
| 2020 | $7,783 | $641,100 | $399,000 | $242,100 |
| 2019 | $7,510 | $583,100 | $399,000 | $184,100 |
| 2018 | $7,151 | $530,900 | $370,500 | $160,400 |
| 2017 | $6,731 | $484,600 | $324,200 | $160,400 |
| 2016 | $6,208 | $453,800 | $306,400 | $147,400 |
| 2015 | $6,101 | $405,900 | $270,800 | $135,100 |
| 2014 | $5,804 | $388,000 | $252,900 | $135,100 |
Source: Public Records
Map
Nearby Homes
- 6 Hovey St
- 129 Waverley Ave Unit 129
- 60 Everett Ave
- 199 Palfrey St
- 214 Palfrey St
- 15 Elmwood Ave
- 220 Westminster Ave
- 9 Bancroft St Unit 11
- 77 Forest St
- 172 Westminster Ave Unit 1
- 50 Carroll St Unit 50
- 79 Waverley Ave Unit 79
- 103 Harnden Ave Unit 103
- 5 Chatham Way Unit 5
- 28 Whitney St
- 5 Mason Rd
- 121 Channing Rd
- 71 Whites Ave Unit 71
- 110 Fayette St
- 98 Carroll St Unit 98
- 169 Worcester St
- 26 Quincy St Unit 28
- 28 Quincy St
- 22 Quincy St
- 22 Quincy St Unit 1
- 22 Quincy St Unit 2
- 77 Springfield St
- 165 Worcester St
- 30 Quincy St Unit 32
- 73 Springfield St
- 32 Quincy St Unit 32
- 16 Quincy St
- 174 Worcester St
- 69 Springfield St
- 34 Quincy St Unit 36
- 170 Worcester St
- 161 Worcester St
- 12 Quincy St
- 65 Springfield St
- 55 Springfield St