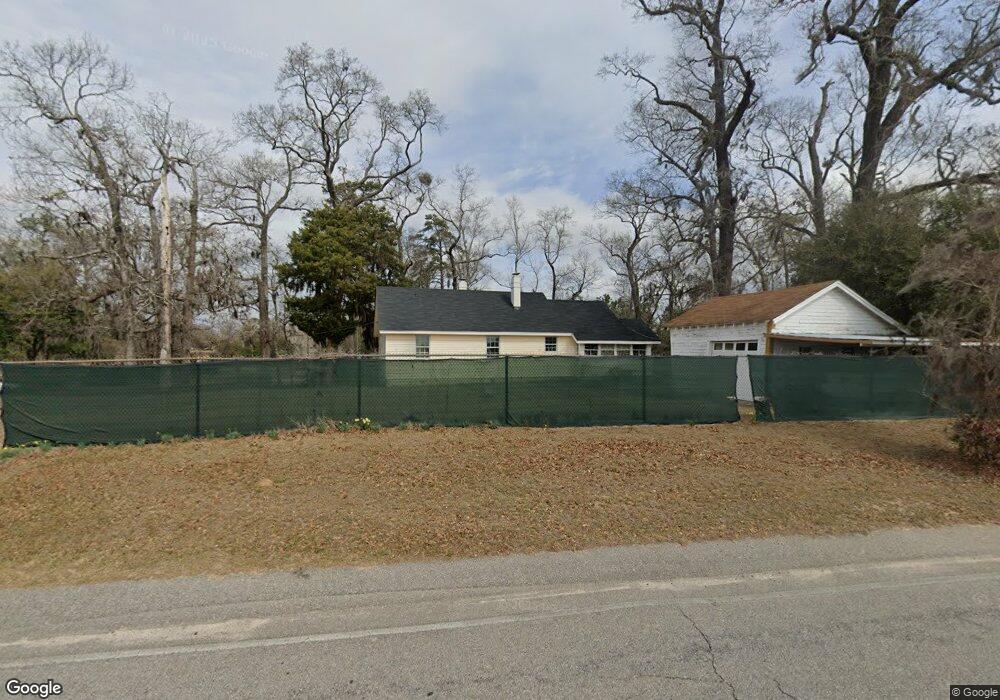
1730 Airport Rd Orangeburg, SC 29115
Estimated Value: $105,000 - $170,000
3
Beds
2
Baths
1,752
Sq Ft
$76/Sq Ft
Est. Value
About This Home
This home is located at 1730 Airport Rd, Orangeburg, SC 29115 and is currently estimated at $133,177, approximately $76 per square foot. 1730 Airport Rd is a home located in Orangeburg County with nearby schools including Rivelon Elementary, Mellichamp Elementary, and Robert E. Howard Middle School.
Ownership History
Date
Name
Owned For
Owner Type
Purchase Details
Closed on
Feb 20, 2019
Sold by
Fannie Mae
Bought by
Butler Darby Cheryl and Darby Eric L
Current Estimated Value
Purchase Details
Closed on
Sep 6, 2018
Sold by
Hamilton Byron and Hamilton Shirlynda
Bought by
Federal National Mortgage Association
Purchase Details
Closed on
Feb 27, 2007
Sold by
Fairey Thomas B
Bought by
Hamilton Byron and Hamilton Shirlynda
Home Financials for this Owner
Home Financials are based on the most recent Mortgage that was taken out on this home.
Original Mortgage
$87,500
Interest Rate
6.16%
Mortgage Type
Purchase Money Mortgage
Purchase Details
Closed on
Feb 21, 2007
Sold by
Fairey Thomas B
Bought by
Fairey Thomas B
Home Financials for this Owner
Home Financials are based on the most recent Mortgage that was taken out on this home.
Original Mortgage
$87,500
Interest Rate
6.16%
Mortgage Type
Purchase Money Mortgage
Create a Home Valuation Report for This Property
The Home Valuation Report is an in-depth analysis detailing your home's value as well as a comparison with similar homes in the area
Home Values in the Area
Average Home Value in this Area
Purchase History
| Date | Buyer | Sale Price | Title Company |
|---|---|---|---|
| Butler Darby Cheryl | $42,450 | None Available | |
| Federal National Mortgage Association | $10,000 | None Available | |
| Hamilton Byron | $87,500 | None Available | |
| Fairey Thomas B | -- | None Available |
Source: Public Records
Mortgage History
| Date | Status | Borrower | Loan Amount |
|---|---|---|---|
| Previous Owner | Hamilton Byron | $87,500 |
Source: Public Records
Tax History Compared to Growth
Tax History
| Year | Tax Paid | Tax Assessment Tax Assessment Total Assessment is a certain percentage of the fair market value that is determined by local assessors to be the total taxable value of land and additions on the property. | Land | Improvement |
|---|---|---|---|---|
| 2024 | $899 | $4,157 | $573 | $3,584 |
| 2023 | $899 | $3,083 | $463 | $2,620 |
| 2022 | $837 | $3,083 | $463 | $2,620 |
| 2021 | $2,263 | $4,625 | $695 | $3,930 |
| 2020 | $2,115 | $4,625 | $0 | $0 |
| 2019 | $2,059 | $4,625 | $0 | $0 |
| 2018 | $1,035 | $4,385 | $0 | $0 |
| 2017 | $715 | $4,385 | $0 | $0 |
| 2016 | $716 | $4,385 | $0 | $0 |
| 2015 | $418 | $4,385 | $0 | $0 |
| 2014 | $418 | $4,385 | $695 | $3,690 |
| 2013 | -- | $3,187 | $463 | $2,724 |
Source: Public Records
Map
Nearby Homes
- 340 Lakeview Dr
- 0 Murray Rd
- 1745 Stonewall Jackson Blvd
- Tbd Robert e Lee Rd
- 1197 Douglas MacArthur St SW
- 0 Robert e Lee St
- 142 Whaley St SE
- 330 Woodbine Dr
- 1296 Union St
- 1067 Greenville St
- 545 Salley St
- 525529 Enterprise St SW Unit A & B
- 1897 Joe S Jeffords Hwy
- Tbd Winslow St SE
- 359 Whaley St SE
- 668 Maple St
- 405 Whaley St
- 423 Whaley St SE
- 982 Glover St
- 208 Sellers St SE
- 430 Lakeview Dr
- 386 Threson St
- 383 Lakeview Dr
- 308 Silkwood St
- 353 Threson St SW
- 341 Silkwood St
- 396 Lakeview Dr
- 347 Lakeview Dr
- 1430 Virginia Rd
- 372 Lakeview Dr
- 333 Lakeview Dr
- 393 Seminole Dr
- 352 Lakeview St SW
- 350 Lakeview St SW
- 327 Lakeview Dr
- 381 Seminole Dr
- 340 Lakeview St SW
- 1398 Virginia Rd
- 371 Seminole Dr
- 360 Lakeview Dr