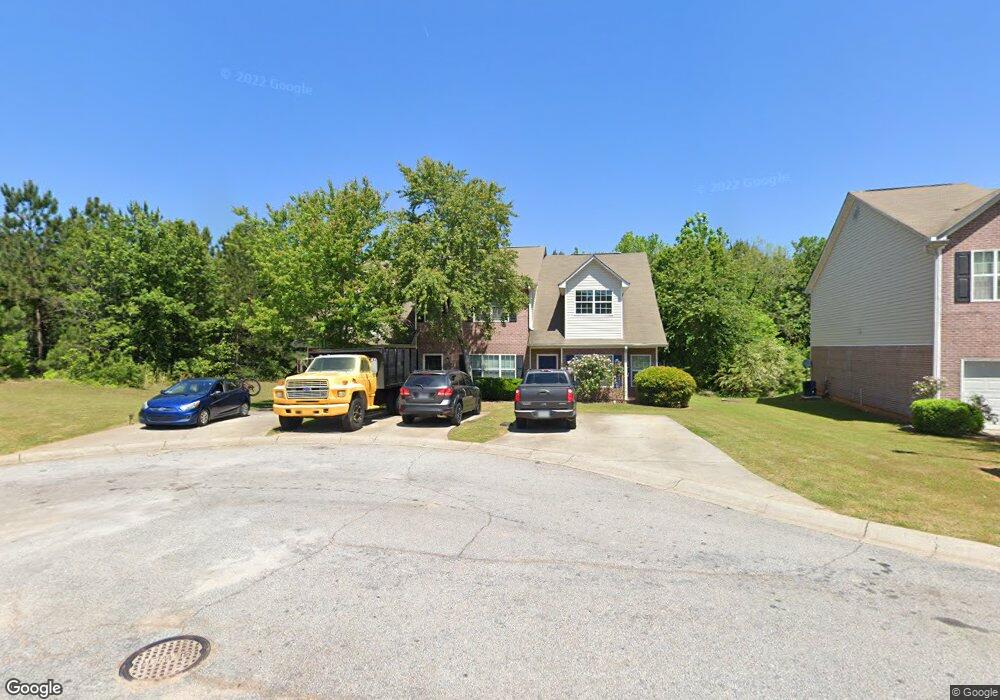
1730 Fielding Way Unit 1730 Hampton, GA 30228
Estimated Value: $160,000 - $212,000
3
Beds
3
Baths
1,520
Sq Ft
$124/Sq Ft
Est. Value
About This Home
This home is located at 1730 Fielding Way Unit 1730, Hampton, GA 30228 and is currently estimated at $188,284, approximately $123 per square foot. 1730 Fielding Way Unit 1730 is a home located in Clayton County with nearby schools including Michelle Obama STEM Elementary Academy, Eddie White Academy, and Lovejoy High School.
Ownership History
Date
Name
Owned For
Owner Type
Purchase Details
Closed on
Mar 30, 2016
Sold by
Thomas Claire
Bought by
Nunez Luis Eduardo and Lievano Sara
Current Estimated Value
Purchase Details
Closed on
Nov 30, 2011
Sold by
Wri Capital Grp Ii Llc
Bought by
Thomas Claire
Purchase Details
Closed on
Nov 8, 2011
Sold by
Bnak Of America Na
Bought by
Wri Capital Grp Ii Llc
Purchase Details
Closed on
May 3, 2011
Sold by
Brewer Lawrence
Bought by
Bank Of America
Purchase Details
Closed on
Apr 26, 2007
Sold by
Jp Morgan Chase Bk
Bought by
Brewer Lawrence
Home Financials for this Owner
Home Financials are based on the most recent Mortgage that was taken out on this home.
Original Mortgage
$94,000
Interest Rate
6.1%
Mortgage Type
New Conventional
Purchase Details
Closed on
Sep 8, 2004
Sold by
Wallace Steve
Bought by
Meyer-Sutton Homes Inc
Create a Home Valuation Report for This Property
The Home Valuation Report is an in-depth analysis detailing your home's value as well as a comparison with similar homes in the area
Home Values in the Area
Average Home Value in this Area
Purchase History
| Date | Buyer | Sale Price | Title Company |
|---|---|---|---|
| Nunez Luis Eduardo | $59,000 | -- | |
| Thomas Claire | $64,900 | -- | |
| Wri Capital Grp Ii Llc | $32,500 | -- | |
| Bank Of America | $28,800 | -- | |
| Brewer Lawrence | $94,000 | -- | |
| Meyer-Sutton Homes Inc | -- | -- |
Source: Public Records
Mortgage History
| Date | Status | Borrower | Loan Amount |
|---|---|---|---|
| Previous Owner | Brewer Lawrence | $94,000 |
Source: Public Records
Tax History Compared to Growth
Tax History
| Year | Tax Paid | Tax Assessment Tax Assessment Total Assessment is a certain percentage of the fair market value that is determined by local assessors to be the total taxable value of land and additions on the property. | Land | Improvement |
|---|---|---|---|---|
| 2025 | $3,104 | $81,040 | $7,200 | $73,840 |
| 2024 | $3,108 | $79,680 | $7,200 | $72,480 |
| 2023 | $2,568 | $71,120 | $7,200 | $63,920 |
| 2022 | $1,956 | $49,840 | $7,200 | $42,640 |
| 2021 | $1,592 | $40,320 | $7,200 | $33,120 |
| 2020 | $1,407 | $35,171 | $7,200 | $27,971 |
| 2019 | $1,303 | $32,094 | $6,000 | $26,094 |
| 2018 | $1,114 | $27,446 | $6,000 | $21,446 |
| 2017 | $998 | $23,600 | $6,000 | $17,600 |
| 2016 | $1,004 | $23,735 | $6,000 | $17,735 |
| 2015 | $995 | $0 | $0 | $0 |
| 2014 | $691 | $16,424 | $6,000 | $10,424 |
Source: Public Records
Map
Nearby Homes
- 1737 Fielding Way
- 1684 Lovejoy Rd
- 1768 Glen View Way
- 1785 Fielding Way
- 2234 Sawgrass Dr
- 11435 S Grove Dr
- 11447 S Grove Dr
- 1738 Blue Heron Way
- 1856 Simmons Ln
- 1869 Dalton Way
- 1756 Beckworth Ln
- 2017 Sawgrass Dr
- 1538 Woodvale St
- 11532 Ethan Ct
- 11569 Kades Trail
- 11187 Shannon Cir
- 11511 Summer Creek Dr
- 1938 Bertha Ct
- 11179 Knotty Pine Place Unit I
- 11224 Aliyah Dr
- 1730 Fielding Way
- 1728 Fielding Way
- 1732 Fielding Way
- 1734 Fielding Way
- 1736 Fielding Way
- 1738 Fielding Way
- 1740 Fielding Way
- 1742 Fielding Way
- 1731 Fielding Way
- 1733 Fielding Way
- 1735 Fielding Way
- 1744 Fielding Way
- 1737 Fielding Way Unit 1737
- 1739 Fielding Way
- 1746 Fielding Way
- 1741 Fielding Way
- 1741 Fielding Way Unit 1741
- 1743 Fielding Way
- 1743 Fielding Way Unit 19
- 1748 Fielding Way