Estimated Value: $131,000 - $188,628
3
Beds
2
Baths
1,289
Sq Ft
$127/Sq Ft
Est. Value
About This Home
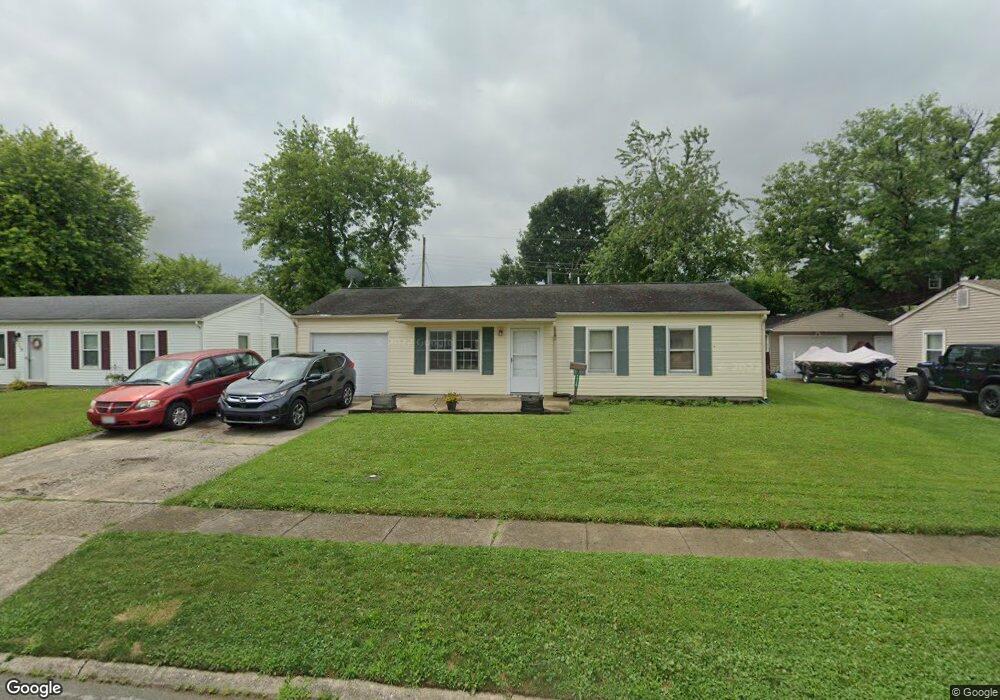
This home is located at 1730 June Dr, Xenia, OH 45385 and is currently estimated at $163,407, approximately $126 per square foot. 1730 June Dr is a home located in Greene County with nearby schools including Xenia High School, Summit Academy Community School for Alternative Learners - Xenia, and Legacy Christian Academy.
Ownership History
Date
Name
Owned For
Owner Type
Purchase Details
Closed on
Jul 20, 2007
Sold by
Fry Allison M and Fry Robert A
Bought by
Bernier Jonathan
Current Estimated Value
Home Financials for this Owner
Home Financials are based on the most recent Mortgage that was taken out on this home.
Original Mortgage
$70,238
Outstanding Balance
$44,426
Interest Rate
6.73%
Mortgage Type
FHA
Estimated Equity
$118,981
Purchase Details
Closed on
Jun 27, 2003
Sold by
Fry Robert A
Bought by
Fry Allison M
Home Financials for this Owner
Home Financials are based on the most recent Mortgage that was taken out on this home.
Original Mortgage
$56,700
Interest Rate
5.37%
Mortgage Type
Unknown
Purchase Details
Closed on
Feb 24, 1999
Sold by
Gill Eric E
Bought by
Fry Robert A and Fry Allison M
Home Financials for this Owner
Home Financials are based on the most recent Mortgage that was taken out on this home.
Original Mortgage
$49,950
Interest Rate
6.83%
Create a Home Valuation Report for This Property
The Home Valuation Report is an in-depth analysis detailing your home's value as well as a comparison with similar homes in the area
Home Values in the Area
Average Home Value in this Area
Purchase History
| Date | Buyer | Sale Price | Title Company |
|---|---|---|---|
| Bernier Jonathan | $70,300 | Vta Title Agency Inc | |
| Fry Allison M | -- | -- | |
| Fry Robert A | $55,500 | -- |
Source: Public Records
Mortgage History
| Date | Status | Borrower | Loan Amount |
|---|---|---|---|
| Open | Bernier Jonathan | $70,238 | |
| Previous Owner | Fry Allison M | $56,700 | |
| Previous Owner | Fry Robert A | $49,950 |
Source: Public Records
Tax History Compared to Growth
Tax History
| Year | Tax Paid | Tax Assessment Tax Assessment Total Assessment is a certain percentage of the fair market value that is determined by local assessors to be the total taxable value of land and additions on the property. | Land | Improvement |
|---|---|---|---|---|
| 2024 | $1,880 | $43,930 | $9,740 | $34,190 |
| 2023 | $1,880 | $43,930 | $9,740 | $34,190 |
| 2022 | $1,535 | $30,600 | $6,950 | $23,650 |
| 2021 | $1,556 | $30,600 | $6,950 | $23,650 |
| 2020 | $1,491 | $30,600 | $6,950 | $23,650 |
| 2019 | $1,212 | $23,420 | $4,680 | $18,740 |
| 2018 | $1,217 | $23,420 | $4,680 | $18,740 |
| 2017 | $1,182 | $23,420 | $4,680 | $18,740 |
| 2016 | $1,149 | $21,700 | $4,680 | $17,020 |
| 2015 | $1,152 | $21,700 | $4,680 | $17,020 |
| 2014 | $1,103 | $21,700 | $4,680 | $17,020 |
Source: Public Records
Map
Nearby Homes
- 121 S Progress Dr
- 1391 June Dr
- 1283 June Dr
- 1342 Kylemore Dr
- 1233 June Dr
- 1223 June Dr
- 1351 Omard Dr
- 1568 Cheyenne Dr
- 1144 Rockwell Dr
- 343 Sheelin Rd
- 1618 Navajo Dr
- 161 Montana Dr
- 1653 Seneca Dr
- 2758 Wyoming Dr
- 912 Omard Dr
- 883 Omard Dr
- 219 Kansas Dr
- 509 Antrim Rd
- 1208 Bellbrook Ave
- 1272 Bellbrook Ave