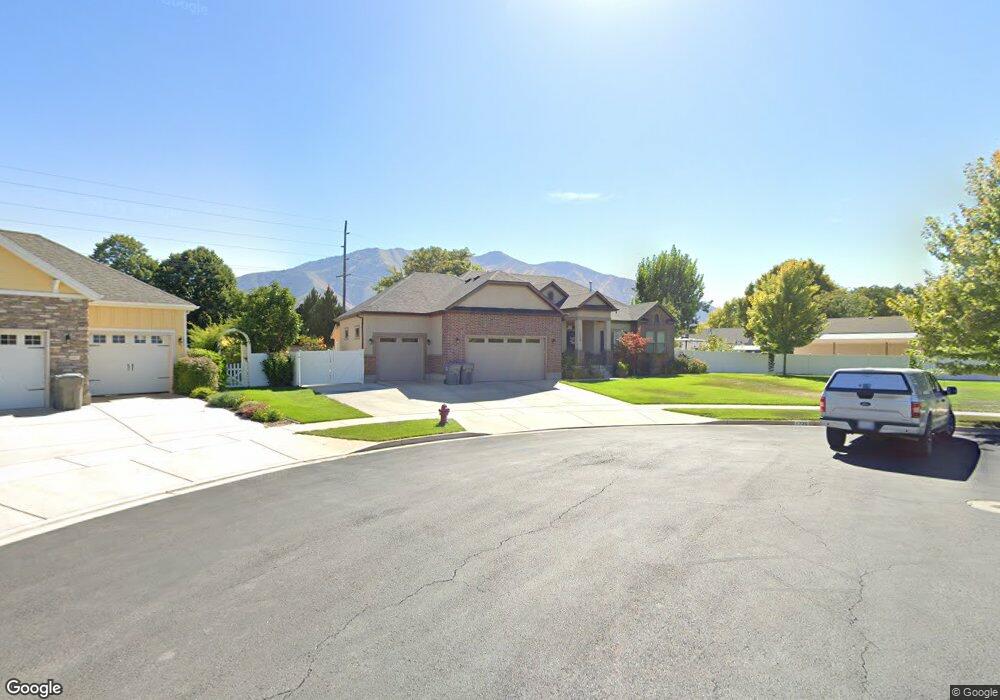
1730 N 1250 W Unit 12 Mapleton, UT 84664
Estimated Value: $750,000 - $880,000
3
Beds
3
Baths
1,906
Sq Ft
$425/Sq Ft
Est. Value
About This Home
This home is located at 1730 N 1250 W Unit 12, Mapleton, UT 84664 and is currently estimated at $810,435, approximately $425 per square foot. 1730 N 1250 W Unit 12 is a home located in Utah County with nearby schools including Mapleton School, Mapleton Junior High School, and Maple Mountain High School.
Ownership History
Date
Name
Owned For
Owner Type
Purchase Details
Closed on
Oct 14, 2020
Sold by
Stringham Richard and Stringham Irene
Bought by
Stringham Richard E and Stringham Irene A
Current Estimated Value
Home Financials for this Owner
Home Financials are based on the most recent Mortgage that was taken out on this home.
Original Mortgage
$150,000
Outstanding Balance
$107,810
Interest Rate
2.9%
Mortgage Type
New Conventional
Estimated Equity
$702,625
Purchase Details
Closed on
Aug 29, 2012
Sold by
D R Horton Inc
Bought by
Stringham Richard and Stringham Irene
Home Financials for this Owner
Home Financials are based on the most recent Mortgage that was taken out on this home.
Original Mortgage
$276,620
Outstanding Balance
$190,686
Interest Rate
3.49%
Mortgage Type
New Conventional
Estimated Equity
$619,749
Purchase Details
Closed on
Jun 16, 2011
Sold by
Sweet Iron Development Llc
Bought by
D R Horton Inc
Create a Home Valuation Report for This Property
The Home Valuation Report is an in-depth analysis detailing your home's value as well as a comparison with similar homes in the area
Home Values in the Area
Average Home Value in this Area
Purchase History
| Date | Buyer | Sale Price | Title Company |
|---|---|---|---|
| Stringham Richard E | -- | Provo Land Title Co | |
| Stringham Richard | -- | Provo Land Title Co | |
| D R Horton Inc | -- | Highland Title |
Source: Public Records
Mortgage History
| Date | Status | Borrower | Loan Amount |
|---|---|---|---|
| Open | Stringham Richard E | $150,000 | |
| Open | Stringham Richard | $276,620 |
Source: Public Records
Tax History
| Year | Tax Paid | Tax Assessment Tax Assessment Total Assessment is a certain percentage of the fair market value that is determined by local assessors to be the total taxable value of land and additions on the property. | Land | Improvement |
|---|---|---|---|---|
| 2025 | $3,598 | $401,885 | -- | -- |
| 2024 | $3,598 | $352,495 | $0 | $0 |
| 2023 | $3,684 | $363,165 | $0 | $0 |
| 2022 | $3,793 | $369,765 | $0 | $0 |
| 2021 | $3,175 | $475,100 | $182,400 | $292,700 |
| 2020 | $3,137 | $454,100 | $161,400 | $292,700 |
| 2019 | $2,771 | $409,400 | $154,900 | $254,500 |
| 2018 | $2,722 | $382,900 | $130,400 | $252,500 |
| 2017 | $2,761 | $206,140 | $0 | $0 |
| 2016 | $2,717 | $201,630 | $0 | $0 |
| 2015 | $2,643 | $194,920 | $0 | $0 |
| 2014 | $2,526 | $182,985 | $0 | $0 |
Source: Public Records
Map
Nearby Homes
- 1121 W 1800 N
- 1372 N 1380 W
- 1424 N 1600 W
- 1294 N 1380 W
- 1403 S 625 E
- 1225 N 1380 W
- 1410 W 1200 N
- 1518 S 600 E
- 405 W 1200 N Unit 4
- 487 W 1200 N Unit 1
- 1525 S 400 E Unit 36
- 1525 S 400 E Unit 63
- 598 W 1600 N
- 1697 N 500 W
- 1264 E 1150 S
- 949 S 1060 E
- 983 W 1000 N
- 899 E 800 S
- 1836 W 800 N
- 677 E 800 South St
- 1760 N 1250 W Unit 13
- 1733 N 1250 W Unit 10
- 1705 N 1100 W
- 1677 N 1100 W
- 1790 N 1250 W
- 1761 N 1250 W
- 1643 N 1100 W
- 1789 N 1250 W
- 1120 W 1700 N
- 1286 W 1600 N
- 1248 W 1600 N
- 1210 W 1600 N
- 1310 W 1600 N
- 1613 N 1100 W
- 1830 N 1250 W Unit 15
- 1830 N 1250 W
- 1678 N 1100 W
- 1088 W 1700 N
- 1089 W 1800 N
- 1823 N 1100 W
Your Personal Tour Guide
Ask me questions while you tour the home.