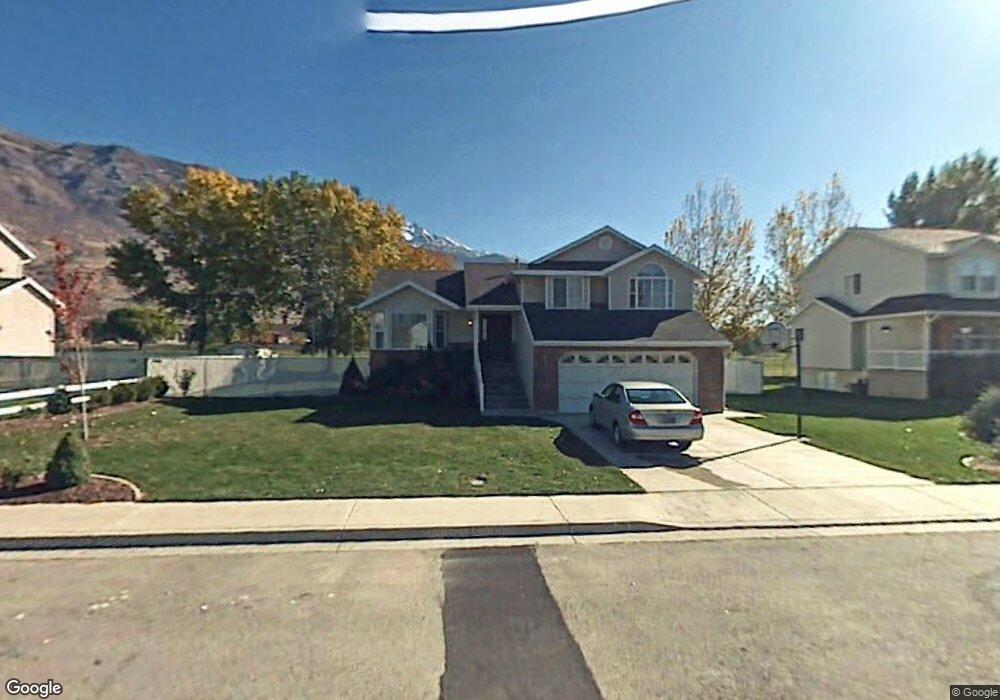
1730 N 270 W Pleasant Grove, UT 84062
Estimated Value: $543,830 - $578,000
3
Beds
2
Baths
1,798
Sq Ft
$313/Sq Ft
Est. Value
About This Home
This home is located at 1730 N 270 W, Pleasant Grove, UT 84062 and is currently estimated at $562,458, approximately $312 per square foot. 1730 N 270 W is a home located in Utah County with nearby schools including Manila Elementary School, Pleasant Grove Junior High School, and Pleasant Grove High School.
Ownership History
Date
Name
Owned For
Owner Type
Purchase Details
Closed on
Jan 10, 2025
Sold by
Taylor Matthew M and Taylor Teri H
Bought by
Taylor Asset Protection Trust and Taylor
Current Estimated Value
Home Financials for this Owner
Home Financials are based on the most recent Mortgage that was taken out on this home.
Original Mortgage
$250,000
Outstanding Balance
$248,223
Interest Rate
6.69%
Mortgage Type
Credit Line Revolving
Estimated Equity
$314,235
Purchase Details
Closed on
Jan 8, 2025
Sold by
Taylor Asset Protection Trust and Taylor Matthew M
Bought by
Taylor Matthew M and Taylor Teri H
Home Financials for this Owner
Home Financials are based on the most recent Mortgage that was taken out on this home.
Original Mortgage
$250,000
Outstanding Balance
$248,223
Interest Rate
6.69%
Mortgage Type
Credit Line Revolving
Estimated Equity
$314,235
Purchase Details
Closed on
Oct 19, 2012
Sold by
Taylor Matthew M and Taylor Teri H
Bought by
Taylor Matthew M A and Taylor Teri H
Home Financials for this Owner
Home Financials are based on the most recent Mortgage that was taken out on this home.
Original Mortgage
$190,000
Interest Rate
3.5%
Mortgage Type
New Conventional
Purchase Details
Closed on
Oct 2, 2012
Sold by
Taylor Matthew M A and Taylor Teri H
Bought by
Taylor Matthew M and Taylor Teri H
Home Financials for this Owner
Home Financials are based on the most recent Mortgage that was taken out on this home.
Original Mortgage
$190,000
Interest Rate
3.5%
Mortgage Type
New Conventional
Purchase Details
Closed on
Feb 5, 2008
Sold by
Taylor Matthew M A and Taylor Teri H
Bought by
Taylor Matthew M A and Taylor Teri H
Home Financials for this Owner
Home Financials are based on the most recent Mortgage that was taken out on this home.
Original Mortgage
$206,400
Interest Rate
5.41%
Mortgage Type
New Conventional
Purchase Details
Closed on
Aug 25, 2004
Sold by
Taylor Matthew M A and Taylor Teri H
Bought by
Taylor Matthew M A and Taylor Teri H
Create a Home Valuation Report for This Property
The Home Valuation Report is an in-depth analysis detailing your home's value as well as a comparison with similar homes in the area
Home Values in the Area
Average Home Value in this Area
Purchase History
| Date | Buyer | Sale Price | Title Company |
|---|---|---|---|
| Taylor Asset Protection Trust | -- | Meridian Title | |
| Taylor Matthew M | -- | Meridian Title | |
| Taylor Matthew M A | -- | Gateway Title Ins Agency | |
| Taylor Matthew M | -- | Gateway Title Insurance Agen | |
| Taylor Matthew M A | -- | First American | |
| Taylor Matthew M A | -- | First American | |
| Taylor Matthew M A | -- | -- |
Source: Public Records
Mortgage History
| Date | Status | Borrower | Loan Amount |
|---|---|---|---|
| Open | Taylor Matthew M | $250,000 | |
| Previous Owner | Taylor Matthew M | $190,000 | |
| Previous Owner | Taylor Matthew M A | $206,400 |
Source: Public Records
Tax History Compared to Growth
Tax History
| Year | Tax Paid | Tax Assessment Tax Assessment Total Assessment is a certain percentage of the fair market value that is determined by local assessors to be the total taxable value of land and additions on the property. | Land | Improvement |
|---|---|---|---|---|
| 2025 | $2,251 | $284,625 | $243,400 | $274,100 |
| 2024 | $2,251 | $268,730 | $0 | $0 |
| 2023 | $2,219 | $271,150 | $0 | $0 |
| 2022 | $2,329 | $283,140 | $0 | $0 |
| 2021 | $1,984 | $367,300 | $152,800 | $214,500 |
| 2020 | $1,846 | $335,000 | $136,400 | $198,600 |
| 2019 | $1,609 | $302,000 | $129,300 | $172,700 |
| 2018 | $1,535 | $272,300 | $122,100 | $150,200 |
| 2017 | $1,498 | $141,515 | $0 | $0 |
| 2016 | $1,413 | $128,865 | $0 | $0 |
| 2015 | $1,481 | $127,930 | $0 | $0 |
| 2014 | $1,389 | $118,800 | $0 | $0 |
Source: Public Records
Map
Nearby Homes
- 1727 N Siena Cir Unit 4
- 1656 N Siena Cir Unit 7
- 1726 N Siena Cir Unit 10
- 532 W 2000 N
- 1051 N 600 W
- 1031 N 600 W
- 1041 N 600 W
- 731 W 1590 N Unit 15
- 1534 N 750 W Unit 16
- 1152 N 200 W
- 674 W 1590 N Unit 11
- Konlee Plan at Makin Dreams
- Alexa Plan at Makin Dreams
- Callahan Plan at Makin Dreams
- Hailey Plan at Makin Dreams
- Alydia Plan at Makin Dreams
- Addison Plan at Makin Dreams
- Julia Plan at Makin Dreams
- 1531 N 750 W Unit 4
- Aaron Plan at Makin Dreams