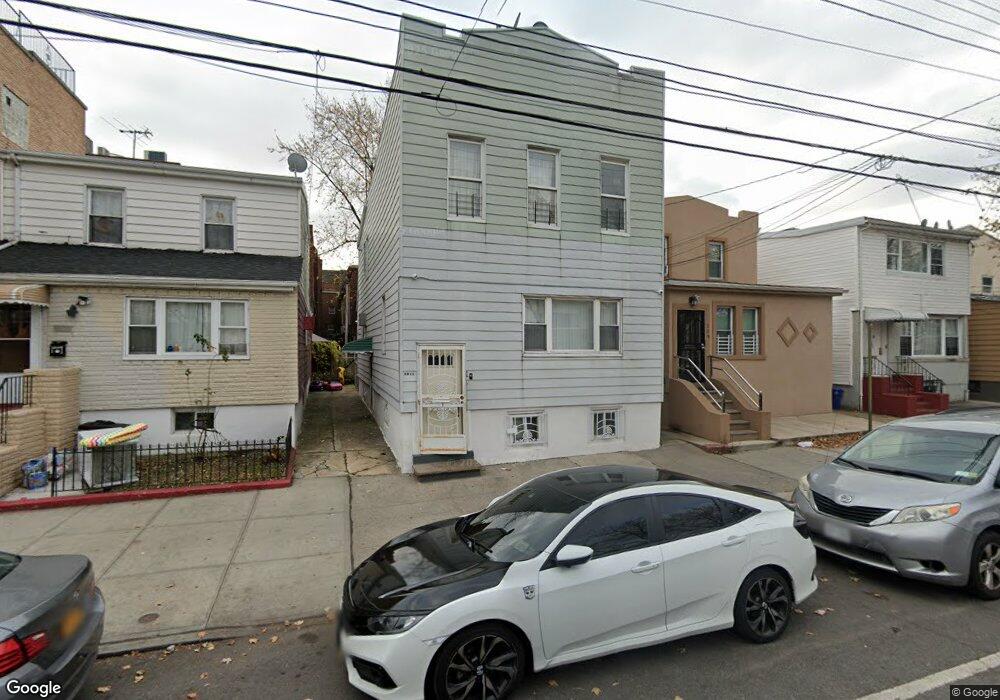
1730 Rockaway Pkwy Unit 2 Brooklyn, NY 11236
Canarsie NeighborhoodEstimated Value: $674,927 - $788,000
2
Beds
1
Bath
1,200
Sq Ft
$627/Sq Ft
Est. Value
About This Home
This home is located at 1730 Rockaway Pkwy Unit 2, Brooklyn, NY 11236 and is currently estimated at $752,482, approximately $627 per square foot. 1730 Rockaway Pkwy Unit 2 is a home located in Kings County with nearby schools including P.S. 279 Herman Schreiber, Is 68 Isaac Bildersee, and Canarsie Ascend Charter School.
Ownership History
Date
Name
Owned For
Owner Type
Purchase Details
Closed on
Dec 23, 2020
Sold by
Medford Sandra M. M
Bought by
Dilworth Keith M. M and Weir-Dilworth Lavorne
Current Estimated Value
Home Financials for this Owner
Home Financials are based on the most recent Mortgage that was taken out on this home.
Original Mortgage
$487,500
Outstanding Balance
$434,020
Interest Rate
2.7%
Mortgage Type
Purchase Money Mortgage
Estimated Equity
$318,462
Purchase Details
Closed on
Aug 25, 1999
Sold by
Didonato Raymond and Didonato Maria
Bought by
Medford Sandra M
Home Financials for this Owner
Home Financials are based on the most recent Mortgage that was taken out on this home.
Original Mortgage
$214,700
Interest Rate
7.86%
Mortgage Type
Purchase Money Mortgage
Create a Home Valuation Report for This Property
The Home Valuation Report is an in-depth analysis detailing your home's value as well as a comparison with similar homes in the area
Home Values in the Area
Average Home Value in this Area
Purchase History
| Date | Buyer | Sale Price | Title Company |
|---|---|---|---|
| Dilworth Keith M. M | $650,000 | -- | |
| Medford Sandra M | $226,000 | Fidelity National Title Ins |
Source: Public Records
Mortgage History
| Date | Status | Borrower | Loan Amount |
|---|---|---|---|
| Open | Dilworth Keith M. M | $487,500 | |
| Previous Owner | Medford Sandra M | $214,700 |
Source: Public Records
Tax History Compared to Growth
Tax History
| Year | Tax Paid | Tax Assessment Tax Assessment Total Assessment is a certain percentage of the fair market value that is determined by local assessors to be the total taxable value of land and additions on the property. | Land | Improvement |
|---|---|---|---|---|
| 2025 | $5,553 | $39,240 | $8,640 | $30,600 |
| 2024 | $5,553 | $40,740 | $8,640 | $32,100 |
| 2023 | $5,573 | $44,220 | $8,640 | $35,580 |
| 2022 | $5,168 | $44,760 | $8,640 | $36,120 |
| 2021 | $5,136 | $36,300 | $8,640 | $27,660 |
| 2020 | $2,262 | $30,360 | $8,640 | $21,720 |
| 2019 | $4,527 | $33,600 | $8,640 | $24,960 |
| 2018 | $4,364 | $22,867 | $6,419 | $16,448 |
| 2017 | $4,098 | $21,573 | $6,858 | $14,715 |
| 2016 | $3,759 | $20,352 | $6,784 | $13,568 |
| 2015 | $2,351 | $19,200 | $9,120 | $10,080 |
| 2014 | $2,351 | $19,200 | $9,120 | $10,080 |
Source: Public Records
Map
Nearby Homes
- 1725 Rockaway Pkwy
- 1707 Rockaway Pkwy
- 9 Holmes Ln
- 1390 E 95th St
- 9722 Avenue K
- 1382 E 95th St
- 1388 E 95th St Unit 1390
- 1130 E 99th St
- 1363 E 94th St
- 1438 E 95th St
- 1419 E 98th St
- 9809 Avenue K
- 1262 E 98th St
- 9609 Avenue M
- 1258 E 98th St
- 1124 E 100th St
- 9301 Avenue L
- 9215 Avenue L
- 10017 Avenue L
- 1241 E 98th St
- 1730 Rockaway Pkwy
- 1728 Rockaway Pkwy
- 1732 Rockaway Pkwy
- 1726 Rockaway Pkwy
- 1726 Rockaway Pkwy Unit 2
- 1734 Rockaway Pkwy
- 1734 Rockaway Pkwy
- 1724 Rockaway Pkwy
- 1387 E 96th St
- 1722 Rockaway Pkwy
- 9623 Avenue L
- 9617 Avenue L
- 1377 E 96th St
- 9625 Avenue L
- 1720 Rockaway Pkwy
- 1373 E 96th St
- 9621 Avenue L
- 1377 E 96 St
- 9627 Avenue L
- 9615 Avenue L