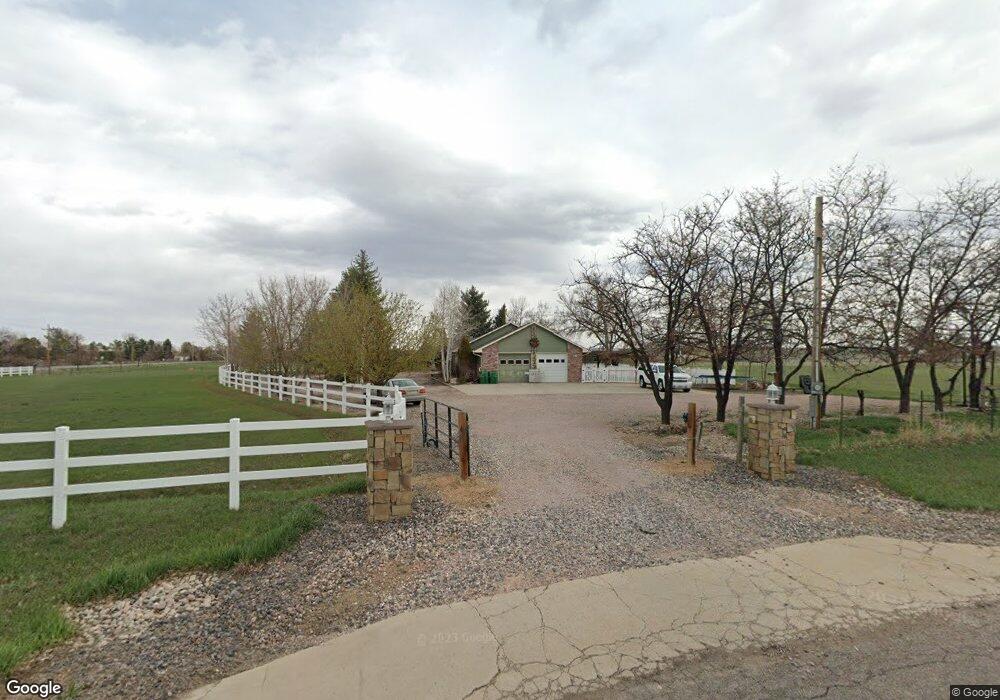
1730 Sheehan Dr Berthoud, CO 80513
Estimated Value: $732,000 - $829,000
2
Beds
2
Baths
1,403
Sq Ft
$555/Sq Ft
Est. Value
About This Home
This home is located at 1730 Sheehan Dr, Berthoud, CO 80513 and is currently estimated at $778,451, approximately $554 per square foot. 1730 Sheehan Dr is a home located in Larimer County with nearby schools including Berthoud Elementary School, Turner Middle School, and Berthoud High School.
Ownership History
Date
Name
Owned For
Owner Type
Purchase Details
Closed on
Aug 15, 2012
Sold by
Sabr Mortgage Loan 2008-1 Reo Subsidiary
Bought by
Anderson Brent and Anderson Lois
Current Estimated Value
Home Financials for this Owner
Home Financials are based on the most recent Mortgage that was taken out on this home.
Original Mortgage
$195,000
Outstanding Balance
$31,076
Interest Rate
3.56%
Mortgage Type
New Conventional
Estimated Equity
$747,375
Purchase Details
Closed on
Apr 25, 2012
Sold by
Ray Todd C and Ray Tammy
Bought by
Sabr Mortgage Loan 2008-I
Purchase Details
Closed on
Apr 23, 1999
Sold by
Zuercher Rebecca T David L
Bought by
Ray Todd C and Ray Tammy
Home Financials for this Owner
Home Financials are based on the most recent Mortgage that was taken out on this home.
Original Mortgage
$275,500
Interest Rate
7.12%
Purchase Details
Closed on
Sep 1, 1994
Sold by
Zuercher Rebecca T
Bought by
Zuercher David L
Create a Home Valuation Report for This Property
The Home Valuation Report is an in-depth analysis detailing your home's value as well as a comparison with similar homes in the area
Home Values in the Area
Average Home Value in this Area
Purchase History
| Date | Buyer | Sale Price | Title Company |
|---|---|---|---|
| Anderson Brent | $275,199 | None Available | |
| Sabr Mortgage Loan 2008-I | -- | None Available | |
| Ray Todd C | $290,000 | -- | |
| Zuercher David L | -- | -- |
Source: Public Records
Mortgage History
| Date | Status | Borrower | Loan Amount |
|---|---|---|---|
| Open | Anderson Brent | $195,000 | |
| Previous Owner | Ray Todd C | $275,500 |
Source: Public Records
Tax History Compared to Growth
Tax History
| Year | Tax Paid | Tax Assessment Tax Assessment Total Assessment is a certain percentage of the fair market value that is determined by local assessors to be the total taxable value of land and additions on the property. | Land | Improvement |
|---|---|---|---|---|
| 2025 | $4,163 | $51,804 | $25,996 | $25,808 |
| 2024 | $4,026 | $51,804 | $25,996 | $25,808 |
| 2022 | $3,238 | $37,544 | $9,139 | $28,405 |
| 2021 | $3,328 | $38,624 | $9,402 | $29,222 |
| 2020 | $2,828 | $32,804 | $15,301 | $17,503 |
| 2019 | $2,787 | $32,804 | $15,301 | $17,503 |
| 2018 | $2,271 | $25,531 | $11,520 | $14,011 |
| 2017 | $1,979 | $25,531 | $11,520 | $14,011 |
| 2016 | $1,751 | $21,898 | $12,736 | $9,162 |
| 2015 | $1,739 | $23,840 | $12,740 | $11,100 |
| 2014 | $1,448 | $17,380 | $12,740 | $4,640 |
Source: Public Records
Map
Nearby Homes
- 1785 Serene Place
- 4808 Beverly Dr
- 0 Beverly Dr
- 1796 Serene Place
- 0 Rodney Ln Unit 1030974
- 6310 W County Road 4
- 15789 N 83rd St
- 205 S County Road 23
- 5306 Foothills Dr
- 3400 Erving Ct
- 3412 Erving Ct
- 0 Lucky Ln
- 1884 Chaparro Cir
- 0 W County Road 8e Unit RECIR1018960
- 2316 Horseshoe Cir
- 3520 W County Road 8
- 1916 W County Road 6
- 9402 Crystal Ln
- 2548 Horseshoe Cir
- 1637 S U S Highway 287
- 6705 W County Road 4
- 6705 W Co Road 4
- 6700 W Co Road 4
- 1731 Sheehan Dr
- 3932 W County Road 4
- 4020 W County Road 4
- 1826 Sheehan Dr
- 1827 Sheehan Dr
- 3823 Arleigh Dr
- 1624 S Green Ridge Rd
- 4113 W County Road 4
- 3810 Arleigh Dr
- 1620 S Green Ridge Rd
- 3871 Arleigh Dr
- 3850 Arleigh Dr
- 3815 W County Road 4
- 4021 Arleigh Dr
- 1621 S Green Ridge Rd
- 3820 W County Road 4
- 3931 Arleigh Dr