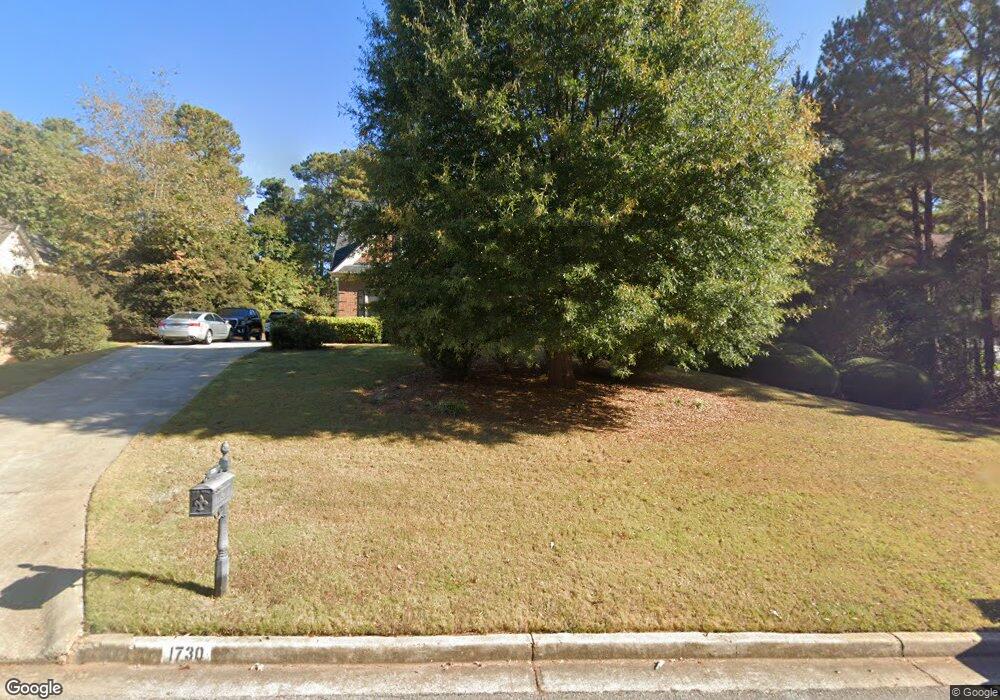
1730 Stratford Crossing SE Unit 2 Conyers, GA 30013
Estimated Value: $444,390 - $575,000
4
Beds
5
Baths
2,702
Sq Ft
$179/Sq Ft
Est. Value
About This Home
This home is located at 1730 Stratford Crossing SE Unit 2, Conyers, GA 30013 and is currently estimated at $483,848, approximately $179 per square foot. 1730 Stratford Crossing SE Unit 2 is a home located in Rockdale County with nearby schools including Flat Shoals Elementary School, Memorial Middle School, and Salem High School.
Ownership History
Date
Name
Owned For
Owner Type
Purchase Details
Closed on
Jul 6, 2018
Sold by
Syed Shaukat A
Bought by
Jones Kellie
Current Estimated Value
Purchase Details
Closed on
Aug 20, 2001
Sold by
Johnson David N
Bought by
Syed Shaukat A
Home Financials for this Owner
Home Financials are based on the most recent Mortgage that was taken out on this home.
Original Mortgage
$225,300
Interest Rate
7.08%
Mortgage Type
New Conventional
Purchase Details
Closed on
Mar 27, 1998
Sold by
The Waterford Development Group Inc
Bought by
Jonson David N
Home Financials for this Owner
Home Financials are based on the most recent Mortgage that was taken out on this home.
Original Mortgage
$196,480
Interest Rate
7.09%
Mortgage Type
New Conventional
Create a Home Valuation Report for This Property
The Home Valuation Report is an in-depth analysis detailing your home's value as well as a comparison with similar homes in the area
Home Values in the Area
Average Home Value in this Area
Purchase History
| Date | Buyer | Sale Price | Title Company |
|---|---|---|---|
| Jones Kellie | $295,000 | -- | |
| Syed Shaukat A | $281,700 | -- | |
| Jonson David N | $245,600 | -- |
Source: Public Records
Mortgage History
| Date | Status | Borrower | Loan Amount |
|---|---|---|---|
| Previous Owner | Syed Shaukat A | $225,300 | |
| Previous Owner | Jonson David N | $196,480 |
Source: Public Records
Tax History Compared to Growth
Tax History
| Year | Tax Paid | Tax Assessment Tax Assessment Total Assessment is a certain percentage of the fair market value that is determined by local assessors to be the total taxable value of land and additions on the property. | Land | Improvement |
|---|---|---|---|---|
| 2024 | $7,860 | $199,720 | $37,800 | $161,920 |
| 2023 | $7,019 | $173,520 | $34,920 | $138,600 |
| 2022 | $6,721 | $166,000 | $34,920 | $131,080 |
| 2021 | $5,503 | $136,600 | $24,080 | $112,520 |
| 2020 | $5,685 | $132,960 | $24,560 | $108,400 |
| 2019 | $5,093 | $113,040 | $15,000 | $98,040 |
| 2018 | $4,426 | $97,760 | $15,000 | $82,760 |
| 2017 | $4,315 | $94,400 | $15,000 | $79,400 |
| 2016 | $3,812 | $83,360 | $15,880 | $67,480 |
| 2015 | $3,816 | $83,360 | $15,880 | $67,480 |
| 2014 | $3,742 | $80,880 | $13,400 | $67,480 |
| 2013 | -- | $102,280 | $24,000 | $78,280 |
Source: Public Records
Map
Nearby Homes
- 2791 Wellington Way SE Unit 1
- 2561 Old Salem Cir SE
- 3095 Brombley Dr SE
- 2405 Old Salem Rd SE Unit 1
- 2052 Evergreen Dr SE
- 2365 Brentmoore Point Unit 3
- 1260 Sweet Shrub Ln SE
- 1180 Azalea Cir SE
- 1613 Brentwood Crossing SE Unit 3
- 3111 Green Gate Way SE
- 2303 Deerfield Chase SE Unit 5
- 1135 Vineyard Dr SE
- 2585 Westchester Way SE
- 1613 Brolington Ct
- 2474 Harvest Dr SE
- 2684 Harvest Dr SE
- 3639 Cape Ln
- 1730 Stratford Crossing SE
- 1720 Stratford Crossing SE Unit 2
- 1740 Stratford Crossing SE Unit 2
- 0 Stratford Crossing SE Unit 7357705
- 0 Stratford Crossing SE Unit 8466552
- 0 Stratford Crossing SE Unit 8194505
- 0 Stratford Crossing SE Unit 7281839
- 0 Stratford Crossing SE Unit 8826470
- 0 Stratford Crossing SE Unit 2963860
- 0 Stratford Crossing SE
- 1750 Stratford Crossing SE
- 1750 Stratford Crossing SE Unit 2
- 1661 Canterbury Pointe SE Unit 1
- 1710 Stratford Crossing SE Unit 2
- 2671 Wellington Way SE
- 1731 Stratford Crossing SE Unit 2
- 1651 Canterbury Pointe SE
- 1741 Stratford Crossing SE
- 1671 Canterbury Pointe SE Unit 1
- 1741 Stratford Crossing SE Unit 2