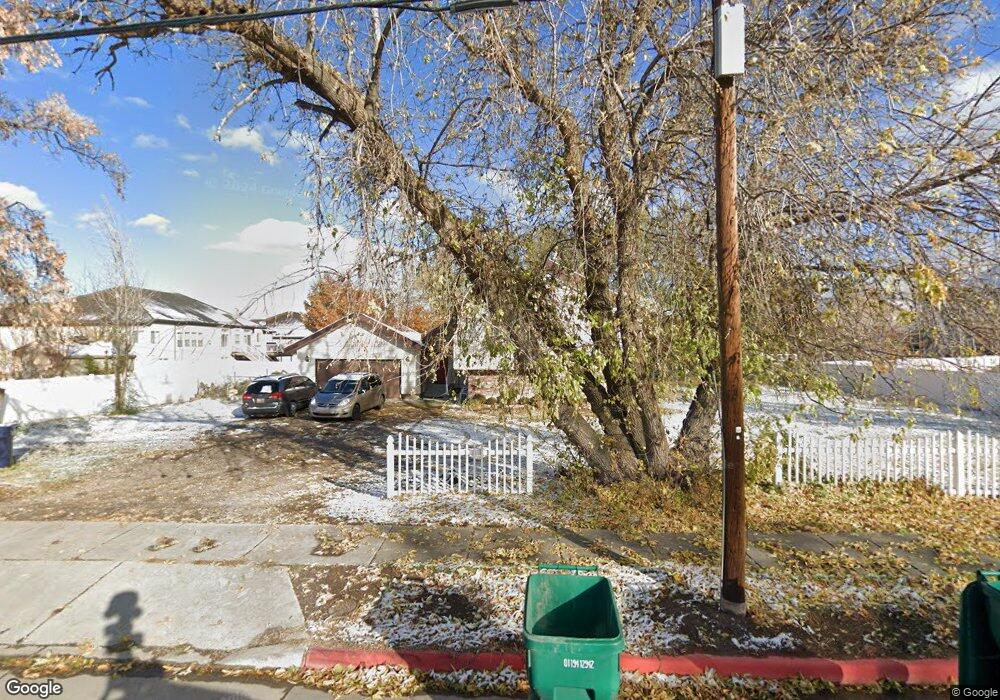
1730 W Gentile St Layton, UT 84041
Estimated Value: $532,000 - $599,239
4
Beds
3
Baths
2,836
Sq Ft
$197/Sq Ft
Est. Value
About This Home
This home is located at 1730 W Gentile St, Layton, UT 84041 and is currently estimated at $558,060, approximately $196 per square foot. 1730 W Gentile St is a home located in Davis County with nearby schools including Ellison Park School, Shoreline Junior High School, and Layton High School.
Ownership History
Date
Name
Owned For
Owner Type
Purchase Details
Closed on
Oct 12, 2022
Sold by
Cheryl L Brown Trust
Bought by
Oliveros Isai Eliseo Merca
Current Estimated Value
Home Financials for this Owner
Home Financials are based on the most recent Mortgage that was taken out on this home.
Original Mortgage
$474,905
Outstanding Balance
$456,374
Interest Rate
6.02%
Mortgage Type
New Conventional
Estimated Equity
$101,686
Purchase Details
Closed on
Jan 31, 2022
Sold by
Brown Cheryl L
Bought by
Cheryl L Brown Trust
Purchase Details
Closed on
Sep 27, 2017
Sold by
Tracey Sean and Tracey Bonnie
Bought by
Brown Cheryl L
Purchase Details
Closed on
Aug 22, 1996
Sold by
Peters Charles Wayne
Bought by
Mclendon Steven D and Mclendon Teresa E
Home Financials for this Owner
Home Financials are based on the most recent Mortgage that was taken out on this home.
Original Mortgage
$129,540
Interest Rate
8.42%
Mortgage Type
VA
Create a Home Valuation Report for This Property
The Home Valuation Report is an in-depth analysis detailing your home's value as well as a comparison with similar homes in the area
Home Values in the Area
Average Home Value in this Area
Purchase History
| Date | Buyer | Sale Price | Title Company |
|---|---|---|---|
| Oliveros Isai Eliseo Merca | -- | Us Title | |
| Cheryl L Brown Trust | -- | None Listed On Document | |
| Brown Cheryl L | -- | -- | |
| Mclendon Steven D | -- | Bonneville Title Company Inc |
Source: Public Records
Mortgage History
| Date | Status | Borrower | Loan Amount |
|---|---|---|---|
| Open | Oliveros Isai Eliseo Merca | $474,905 | |
| Previous Owner | Mclendon Steven D | $129,540 |
Source: Public Records
Tax History Compared to Growth
Tax History
| Year | Tax Paid | Tax Assessment Tax Assessment Total Assessment is a certain percentage of the fair market value that is determined by local assessors to be the total taxable value of land and additions on the property. | Land | Improvement |
|---|---|---|---|---|
| 2025 | $2,824 | $296,450 | $155,723 | $140,727 |
| 2024 | $2,767 | $292,600 | $155,003 | $137,597 |
| 2023 | $2,645 | $493,000 | $237,348 | $255,652 |
| 2022 | $2,864 | $289,850 | $117,902 | $171,948 |
| 2021 | $2,597 | $392,000 | $176,681 | $215,319 |
| 2020 | $2,348 | $340,000 | $156,282 | $183,718 |
| 2019 | $451 | $330,000 | $141,702 | $188,298 |
| 2018 | $2,086 | $297,000 | $126,248 | $170,752 |
| 2016 | $1,712 | $125,730 | $59,515 | $66,215 |
| 2015 | $1,646 | $114,785 | $59,515 | $55,270 |
| 2014 | $1,584 | $112,974 | $59,515 | $53,459 |
| 2013 | -- | $109,403 | $47,408 | $61,995 |
Source: Public Records
Map
Nearby Homes
- 37 N Swift Creek Dr
- 163 Cold Creek Way
- 1606 W 200 N
- 306 Swift Creek Dr
- Browning Plan at Amber Fields
- Rhapsody Plan at Amber Fields
- Accord Plan at Amber Fields
- Timpani Plan at Amber Fields
- Octave Plan at Amber Fields
- Tempo Plan at Amber Fields
- Harvard Plan at Amber Fields
- Fortissimo Plan at Amber Fields
- Forte Plan at Amber Fields
- Interlude Plan at Amber Fields
- Concerto Plan at Amber Fields
- Bravo Plan at Amber Fields
- Capitol Plan at Amber Fields
- Anthem Plan at Amber Fields
- Adagio Plan at Amber Fields
- Trio Plan at Amber Fields
- 16 N Swift Creek Dr
- 16 Swift Creek Dr
- 15 Cold Creek Way
- 34 Swift Creek Dr
- 1751 W 75 N
- 52 N Swift Creek Dr
- 1773 W 75 N
- 35 Cold Creek Way
- 1757 W Gentile St
- 1723 W Gentile St
- 17 Swift Creek Dr
- 37 Swift Creek Dr
- 55 Cold Creek Way
- 53 Swift Creek Dr
- 17 N Swift Creek Dr
- 1750 W 75 N
- 1726 W 75 N
- 53 N Swift Creek Dr
- 1680 W Gentile St
- 1785 W Gentile St