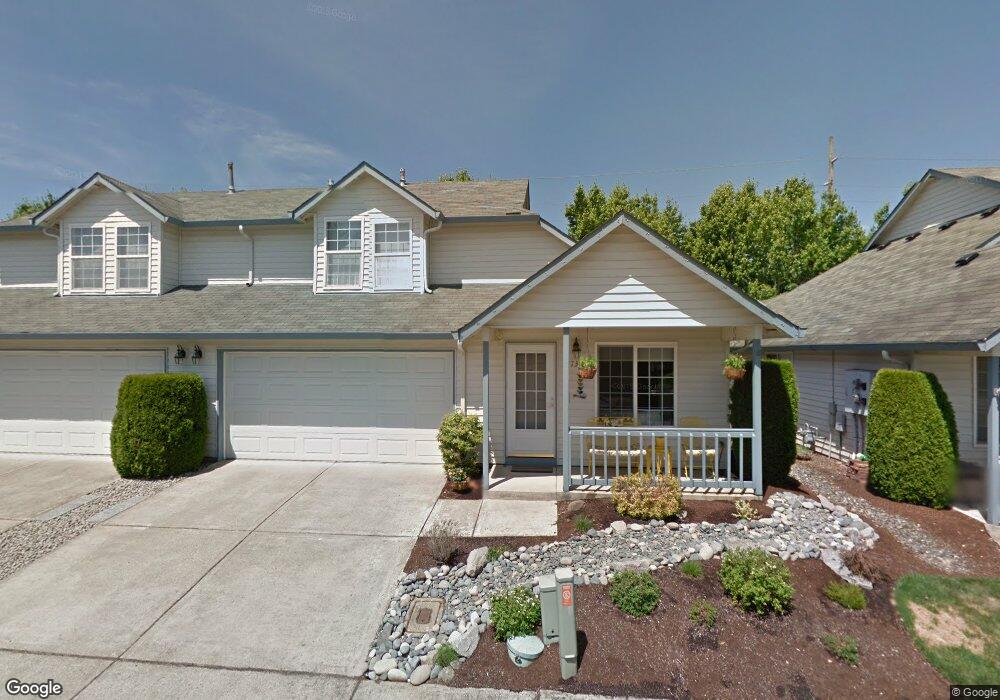
17302 SE 15th Way Unit 17 Vancouver, WA 98683
Fisher's Landing East NeighborhoodEstimated Value: $380,000 - $416,000
3
Beds
3
Baths
1,427
Sq Ft
$278/Sq Ft
Est. Value
About This Home
This home is located at 17302 SE 15th Way Unit 17, Vancouver, WA 98683 and is currently estimated at $397,004, approximately $278 per square foot. 17302 SE 15th Way Unit 17 is a home located in Clark County with nearby schools including Columbia Valley Elementary School, Shahala Middle School, and Union High School.
Ownership History
Date
Name
Owned For
Owner Type
Purchase Details
Closed on
May 8, 2012
Sold by
Lindgren Patricia A
Bought by
Herrera Jeanette Kuhr
Current Estimated Value
Home Financials for this Owner
Home Financials are based on the most recent Mortgage that was taken out on this home.
Original Mortgage
$118,125
Outstanding Balance
$81,996
Interest Rate
3.94%
Mortgage Type
New Conventional
Estimated Equity
$315,008
Purchase Details
Closed on
Jun 21, 2007
Sold by
Anderson Dorothy J
Bought by
Lindgren Rodger O and Lindgren Patricia A
Purchase Details
Closed on
Feb 12, 1998
Sold by
Quail Construction Inc
Bought by
Anderson Victor S and Anderson Dorothy J
Home Financials for this Owner
Home Financials are based on the most recent Mortgage that was taken out on this home.
Original Mortgage
$91,000
Interest Rate
6.9%
Mortgage Type
Purchase Money Mortgage
Create a Home Valuation Report for This Property
The Home Valuation Report is an in-depth analysis detailing your home's value as well as a comparison with similar homes in the area
Home Values in the Area
Average Home Value in this Area
Purchase History
| Date | Buyer | Sale Price | Title Company |
|---|---|---|---|
| Herrera Jeanette Kuhr | $157,500 | Chicago Title Insurance Co | |
| Lindgren Rodger O | $227,000 | Stewart Title | |
| Anderson Victor S | $131,479 | First American Title |
Source: Public Records
Mortgage History
| Date | Status | Borrower | Loan Amount |
|---|---|---|---|
| Open | Herrera Jeanette Kuhr | $118,125 | |
| Previous Owner | Anderson Victor S | $91,000 |
Source: Public Records
Tax History Compared to Growth
Tax History
| Year | Tax Paid | Tax Assessment Tax Assessment Total Assessment is a certain percentage of the fair market value that is determined by local assessors to be the total taxable value of land and additions on the property. | Land | Improvement |
|---|---|---|---|---|
| 2025 | $3,429 | $397,995 | -- | $397,995 |
| 2024 | $3,431 | $346,238 | -- | $346,238 |
| 2023 | $3,436 | $280,987 | $0 | $280,987 |
| 2022 | $3,074 | $355,746 | $0 | $355,746 |
| 2021 | $2,978 | $301,827 | $0 | $301,827 |
| 2020 | $2,916 | $276,165 | $0 | $276,165 |
| 2019 | $2,393 | $272,964 | $0 | $272,964 |
| 2018 | $2,716 | $240,872 | $0 | $0 |
| 2017 | $2,285 | $219,722 | $0 | $0 |
| 2016 | $2,201 | $191,400 | $0 | $0 |
| 2015 | $2,095 | $176,534 | $0 | $0 |
| 2014 | -- | $160,630 | $0 | $0 |
| 2013 | -- | $146,165 | $0 | $0 |
Source: Public Records
Map
Nearby Homes
- 17311 SE 15th Way Unit 80
- 17402 SE 18th St
- 17004 SE 16th St
- 17420 SE 18th St
- 1819 SE 173rd Ave
- 17813 SE 17th Ln
- 17146 SE 23rd Dr Unit 29
- 17146 SE 23rd Dr Unit 68
- 17146 SE 23rd Dr Unit 20
- 17812 SE 12th Dr
- 1617 SE 180th Ave
- 1606 SE 181st Ave
- 1602 SE 181st Ave
- 1604 181st Ave
- 1316 SE 181st Ave
- 18105 17th St
- 18107 17th St
- 18109 17th St
- 1300 SE 181st Ave
- 18213 SE 18th St
- 17413 SE 15th Way Unit 86
- 17411 SE 15th Way Unit 85
- 17407 SE 15th Way Unit 84
- 17405 SE 15th Way Unit 83
- 17403 SE 15th Way Unit 82
- 17401 SE 15th Way Unit 81
- 17309 SE 15th Way Unit 79
- 17307 SE 15th Way Unit 78
- 17305 SE 15th Way Unit 77
- 17303 SE 15th Way Unit 76
- 17301 SE 15th Way Unit 75
- 1510 SE 173rd Ave Unit 24
- 1508 SE 173rd Ave Unit 23
- 1506 SE 173rd Ave Unit 22
- 1504 SE 173rd Ave Unit 21
- 1502 SE 173rd Ave Unit 20
- 1500 SE 173rd Ave Unit 19
- 17300 SE 15th Way
- 17304 SE 15th Way Unit 16
- 17306 SE 15th Way Unit 15