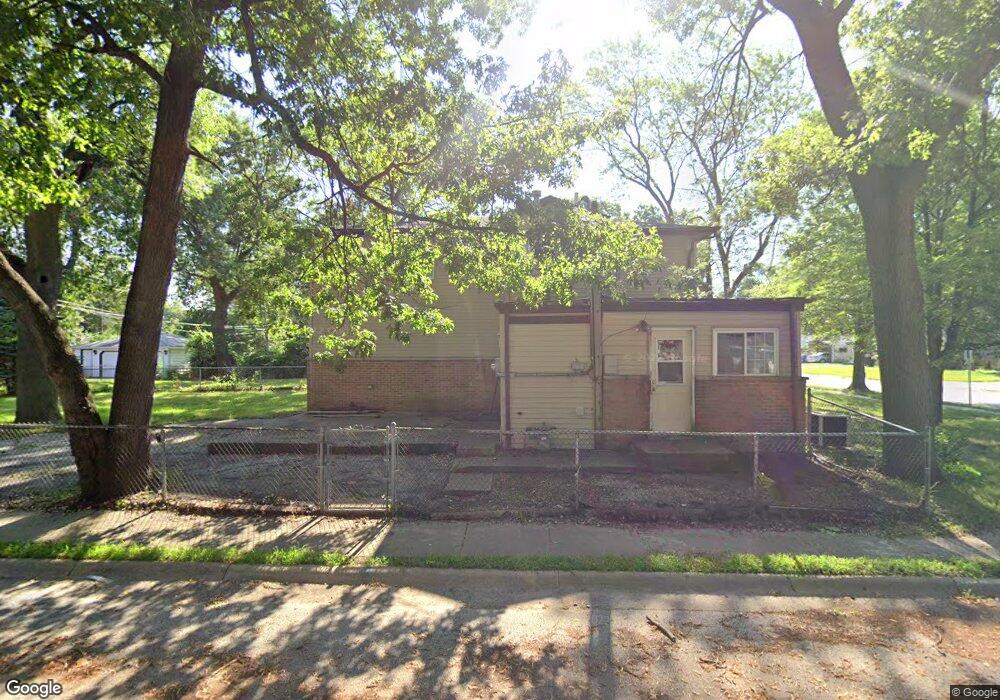
17305 Forest Way Dr East Hazel Crest, IL 60429
Estimated Value: $240,000 - $339,000
5
Beds
3
Baths
2,231
Sq Ft
$127/Sq Ft
Est. Value
About This Home
This home is located at 17305 Forest Way Dr, East Hazel Crest, IL 60429 and is currently estimated at $284,342, approximately $127 per square foot. 17305 Forest Way Dr is a home located in Cook County with nearby schools including Thornwood High School.
Ownership History
Date
Name
Owned For
Owner Type
Purchase Details
Closed on
Jul 7, 2015
Sold by
Pettus Flora
Bought by
Walk The Planet Llc
Current Estimated Value
Purchase Details
Closed on
Mar 24, 2008
Sold by
Federal Home Loan Mortgage Corporation
Bought by
Pettus Flora
Purchase Details
Closed on
Jan 25, 2006
Sold by
Lee
Bought by
Federal Home Loan Mortgage Corporation
Purchase Details
Closed on
Apr 25, 2003
Sold by
Meyers Louise
Bought by
Lee Terry
Home Financials for this Owner
Home Financials are based on the most recent Mortgage that was taken out on this home.
Original Mortgage
$137,750
Interest Rate
5.9%
Mortgage Type
Unknown
Purchase Details
Closed on
Apr 5, 2003
Sold by
Va
Bought by
Meyers Louise
Home Financials for this Owner
Home Financials are based on the most recent Mortgage that was taken out on this home.
Original Mortgage
$137,750
Interest Rate
5.9%
Mortgage Type
Unknown
Purchase Details
Closed on
Apr 19, 2002
Sold by
Taylor Edward Floyd and Taylor Jackie L
Bought by
Va
Create a Home Valuation Report for This Property
The Home Valuation Report is an in-depth analysis detailing your home's value as well as a comparison with similar homes in the area
Home Values in the Area
Average Home Value in this Area
Purchase History
| Date | Buyer | Sale Price | Title Company |
|---|---|---|---|
| Walk The Planet Llc | -- | -- | |
| Pettus Flora | -- | None Available | |
| Federal Home Loan Mortgage Corporation | -- | None Available | |
| Lee Terry | $150,000 | Chicago Title Insurance Comp | |
| Lee Terry | $150,000 | Chicago Title Insurance Comp | |
| Meyers Louise | -- | -- | |
| Meyers Louise | -- | -- | |
| Va | -- | -- |
Source: Public Records
Mortgage History
| Date | Status | Borrower | Loan Amount |
|---|---|---|---|
| Previous Owner | Lee Terry | $137,750 |
Source: Public Records
Tax History Compared to Growth
Tax History
| Year | Tax Paid | Tax Assessment Tax Assessment Total Assessment is a certain percentage of the fair market value that is determined by local assessors to be the total taxable value of land and additions on the property. | Land | Improvement |
|---|---|---|---|---|
| 2024 | $11,590 | $22,300 | $2,600 | $19,700 |
| 2023 | $12,588 | $22,300 | $2,600 | $19,700 |
| 2022 | $12,588 | $19,345 | $2,275 | $17,070 |
| 2021 | $12,357 | $19,344 | $2,275 | $17,069 |
| 2020 | $11,852 | $19,344 | $2,275 | $17,069 |
| 2019 | $10,366 | $17,334 | $2,112 | $15,222 |
| 2018 | $10,252 | $17,334 | $2,112 | $15,222 |
| 2017 | $10,303 | $17,334 | $2,112 | $15,222 |
| 2016 | $8,626 | $15,373 | $1,950 | $13,423 |
| 2015 | $8,342 | $15,373 | $1,950 | $13,423 |
| 2014 | $8,183 | $15,373 | $1,950 | $13,423 |
| 2013 | $8,326 | $16,950 | $1,950 | $15,000 |
Source: Public Records
Map
Nearby Homes
- 17308 Forestway Dr
- 17222 Country Ln
- 17212 Hawthorne Dr
- 1848 172nd St
- 1921 171st St
- 1903 171st St
- 17064 Shea Ave
- 17046 Winchester Ave
- 1913 170th St
- 17026 Bulger Ave
- 2030 170th St
- 2109 Magnolia Rd
- 2131 170th St
- 16930 Winchester Ave
- 16918 Shea Ave
- 16910 Lincoln St
- 16929 Wood St
- 1514 173rd St
- 16919 Wood St
- 16927 Crane Ave
- 17305 Forestway Dr
- 17307 Forestway Dr
- 17309 Forestway Dr
- 17303 Forestway Dr
- 17311 Forestway Dr
- 17306 Forestway Dr
- 17301 Forestway Dr
- 17302 Forestway Dr
- 17316 Forestway Dr
- 17314 Forestway Dr
- 17318 Forestway Dr
- 17300 Forestway Dr
- 17313 Forestway Dr
- 17221 Forestway Dr
- 17220 Country Ln
- 17320 Forestway Dr
- 17312 Forestway Dr
- 17310 Forestway Dr
- 17315 Forestway Dr
- 17219 Forestway Dr