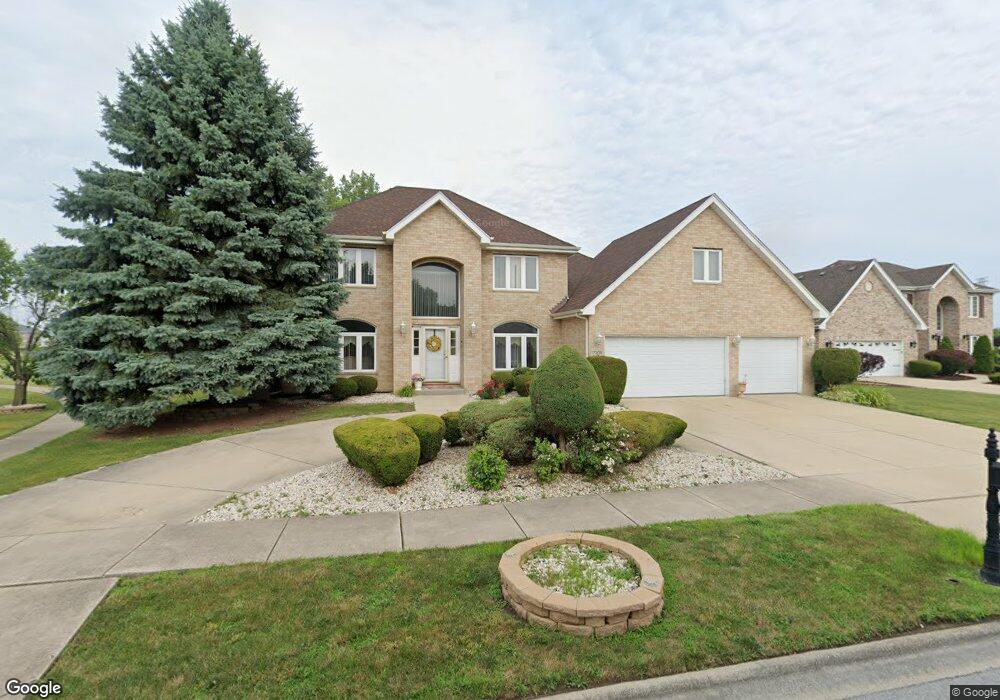
17305 Sterling Ct South Holland, IL 60473
Estimated Value: $367,000 - $487,000
3
Beds
3
Baths
2,765
Sq Ft
$152/Sq Ft
Est. Value
About This Home
This home is located at 17305 Sterling Ct, South Holland, IL 60473 and is currently estimated at $421,191, approximately $152 per square foot. 17305 Sterling Ct is a home located in Cook County with nearby schools including Greenwood Elementary School, Mckinley Elementary School, and Mckinley Jr High School.
Ownership History
Date
Name
Owned For
Owner Type
Purchase Details
Closed on
Jun 8, 2021
Sold by
Davis Thelma and Davis Oscar L
Bought by
Davis Thelma
Current Estimated Value
Home Financials for this Owner
Home Financials are based on the most recent Mortgage that was taken out on this home.
Original Mortgage
$225,300
Outstanding Balance
$203,885
Interest Rate
2.87%
Mortgage Type
VA
Estimated Equity
$217,306
Purchase Details
Closed on
Jun 30, 2000
Sold by
Davis Oscar L
Bought by
Davis Oscar L and Davis Thelma
Home Financials for this Owner
Home Financials are based on the most recent Mortgage that was taken out on this home.
Original Mortgage
$33,500
Interest Rate
12.35%
Mortgage Type
Stand Alone Second
Purchase Details
Closed on
May 14, 1999
Sold by
Premier Homes Inc
Bought by
Davis Oscar L
Home Financials for this Owner
Home Financials are based on the most recent Mortgage that was taken out on this home.
Original Mortgage
$256,770
Interest Rate
7.04%
Create a Home Valuation Report for This Property
The Home Valuation Report is an in-depth analysis detailing your home's value as well as a comparison with similar homes in the area
Home Values in the Area
Average Home Value in this Area
Purchase History
| Date | Buyer | Sale Price | Title Company |
|---|---|---|---|
| Davis Thelma | -- | First American Title | |
| Davis Oscar L | -- | Lakeshore Title Agency | |
| Davis Oscar L | $285,500 | First American Title |
Source: Public Records
Mortgage History
| Date | Status | Borrower | Loan Amount |
|---|---|---|---|
| Open | Davis Thelma | $225,300 | |
| Closed | Davis Oscar L | $33,500 | |
| Closed | Davis Oscar L | $256,770 |
Source: Public Records
Tax History Compared to Growth
Tax History
| Year | Tax Paid | Tax Assessment Tax Assessment Total Assessment is a certain percentage of the fair market value that is determined by local assessors to be the total taxable value of land and additions on the property. | Land | Improvement |
|---|---|---|---|---|
| 2024 | $13,239 | $32,000 | $7,169 | $24,831 |
| 2023 | -- | $32,000 | $7,169 | $24,831 |
| 2022 | $0 | $22,664 | $6,192 | $16,472 |
| 2021 | $11,065 | $22,663 | $6,191 | $16,472 |
| 2020 | $11,065 | $22,663 | $6,191 | $16,472 |
| 2019 | $11,065 | $23,596 | $5,214 | $18,382 |
| 2018 | $0 | $23,596 | $5,214 | $18,382 |
| 2017 | $0 | $23,596 | $5,214 | $18,382 |
| 2016 | $4,443 | $21,312 | $4,888 | $16,424 |
| 2015 | $8,079 | $21,312 | $4,888 | $16,424 |
| 2014 | $7,923 | $21,312 | $4,888 | $16,424 |
| 2013 | $9,324 | $21,561 | $4,888 | $16,673 |
Source: Public Records
Map
Nearby Homes
- 2155 Bernice Rd
- 2005 Fairview Ln
- 2237 175th St Unit 1B
- 2237 175th St Unit 2B
- 2304 Holiday Terrace Unit 503
- 2306 Holiday Terrace Unit 149
- 2306 Holiday Terrace Unit 163
- 2306 Holiday Terrace Unit 146
- 2024 E 171st Ct
- 2216 177th St
- 17048 Clyde Ave
- 2307 177th St
- 1970 E 170th St
- 16909 Paxton Ave
- 17871 Locust St
- 16822 Merrill Ave
- 1991 Indiana Ave
- 17934 Locust St
- 16747 Paxton Ave
- 17700 Escanaba Ave
- 2110 Fairview Ln
- 17300 Sterling Ct
- 2100 Fairview Ln
- 17310 Sterling Ct
- 17325 Sterling Ct
- 2090 Fairview Ln
- 17335 Sterling Ct
- 17320 Sterling Ct
- 17305 Royal Ct
- 2080 Fairview Ln
- 17315 Royal Ct
- 2125 Sunset Ln
- 2145 Sunset Ln
- 2115 Sunset Ln
- 2155 Sunset Ln
- 17325 Royal Ct
- 2070 Fairview Ln
- 2105 Sunset Ln
- 2203 Bernice Rd
- 17287 Heritage Dr