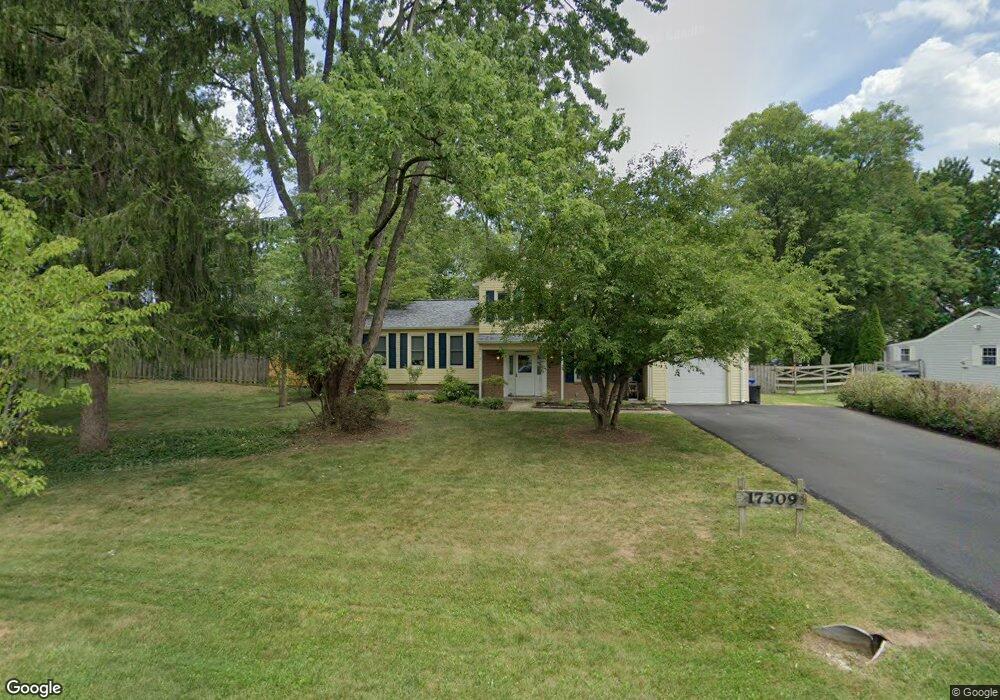
17309 Hoskinson Rd Unit 132 Poolesville, MD 20837
Estimated Value: $613,000 - $687,000
--
Bed
3
Baths
1,494
Sq Ft
$435/Sq Ft
Est. Value
About This Home
This home is located at 17309 Hoskinson Rd Unit 132, Poolesville, MD 20837 and is currently estimated at $650,578, approximately $435 per square foot. 17309 Hoskinson Rd Unit 132 is a home located in Montgomery County with nearby schools including Poolesville Elementary School, John H. Poole Middle School, and Poolesville High School.
Ownership History
Date
Name
Owned For
Owner Type
Purchase Details
Closed on
Oct 26, 2023
Sold by
Beyer Krista Lynn and Berkland Janice Lark
Bought by
Horan Kathy Jo
Current Estimated Value
Home Financials for this Owner
Home Financials are based on the most recent Mortgage that was taken out on this home.
Original Mortgage
$444,000
Outstanding Balance
$435,768
Interest Rate
7.18%
Mortgage Type
New Conventional
Estimated Equity
$214,810
Purchase Details
Closed on
Jul 14, 2020
Sold by
Berkland Janice Lark
Bought by
Berkland Janice Lark and Beyer Krista Lynn
Purchase Details
Closed on
Dec 2, 2016
Sold by
Kinney John James and Kinney Axinn
Bought by
Berkland Janice Lark
Purchase Details
Closed on
Jul 22, 1998
Sold by
C Alan M and C Ziter R
Bought by
John J Kinney 3Rd & Jill Axinn & Kinney and Jill Axinn
Create a Home Valuation Report for This Property
The Home Valuation Report is an in-depth analysis detailing your home's value as well as a comparison with similar homes in the area
Home Values in the Area
Average Home Value in this Area
Purchase History
| Date | Buyer | Sale Price | Title Company |
|---|---|---|---|
| Horan Kathy Jo | $600,000 | Commonwealth Land Title | |
| Horan Kathy Jo | $600,000 | Commonwealth Land Title | |
| Berkland Janice Lark | -- | Home Team Title | |
| Berkland Janice Lark | -- | Home Team Title | |
| Berkland Janice Lark | $395,000 | Home Team Title | |
| John J Kinney 3Rd & Jill Axinn & Kinney | $150,500 | -- |
Source: Public Records
Mortgage History
| Date | Status | Borrower | Loan Amount |
|---|---|---|---|
| Open | Horan Kathy Jo | $444,000 | |
| Closed | Horan Kathy Jo | $444,000 |
Source: Public Records
Tax History Compared to Growth
Tax History
| Year | Tax Paid | Tax Assessment Tax Assessment Total Assessment is a certain percentage of the fair market value that is determined by local assessors to be the total taxable value of land and additions on the property. | Land | Improvement |
|---|---|---|---|---|
| 2025 | $5,478 | $486,200 | -- | -- |
| 2024 | $5,478 | $422,400 | $194,200 | $228,200 |
| 2023 | $5,855 | $402,833 | $0 | $0 |
| 2022 | $4,073 | $383,267 | $0 | $0 |
| 2021 | $1,891 | $363,700 | $194,200 | $169,500 |
| 2020 | $1,891 | $360,233 | $0 | $0 |
| 2019 | $3,749 | $356,767 | $0 | $0 |
| 2018 | $3,719 | $353,300 | $194,200 | $159,100 |
| 2017 | $4,368 | $346,233 | $0 | $0 |
| 2016 | -- | $339,167 | $0 | $0 |
| 2015 | $4,014 | $332,100 | $0 | $0 |
| 2014 | $4,014 | $332,100 | $0 | $0 |
Source: Public Records
Map
Nearby Homes
- 17500 Hoskinson Rd
- 19724 Wootton Ave
- 19509 Fisher Ave Unit (LOT 2)
- 19507 Fisher Ave Unit (LOT 3)
- 19505 Fisher Ave Unit (LOT 1)
- 19916 Westerly Ave
- 19110 Way
- 17403 Fyffe Rd
- The Veranda Plan at Ferry Crossing
- Breezeway Plan at Ferry Crossing
- The Terrace Plan at Ferry Crossing
- 19225 Walters Ave
- 17528 Collier Cir
- 17914 Hickman St
- The Walton Plan at Knob Hill Estates at Madison Fields
- 17100 Wild Turkey Way
- 17108 Wild Turkey Way
- The Longfellow Plan at Knob Hill Estates at Madison Fields
- 21331 Big Woods Rd
- The Vermeer Plan at Knob Hill Estates at Madison Fields
- 17309 Hoskinson Rd
- 17320 Chiswell Rd
- 17316 Chiswell Rd
- 17301 Hoskinson Rd
- 17312 Chiswell Rd
- 17216 Whites Rd
- 17308 Chiswell Rd
- 17308 Hoskinson Rd
- 17304 Hoskinson Rd
- 17212 Whites Rd
- 17217 Hoskinson Rd
- 17300 Chiswell Rd
- 17400 Chiswell Rd
- 19801 Spurrier Ave
- 17325 Chiswell Rd
- 17220 Chiswell Rd
- 17213 Whites Rd
- 17213 Hoskinson Rd
- 17404 Chiswell Rd
- 17208 Whites Rd