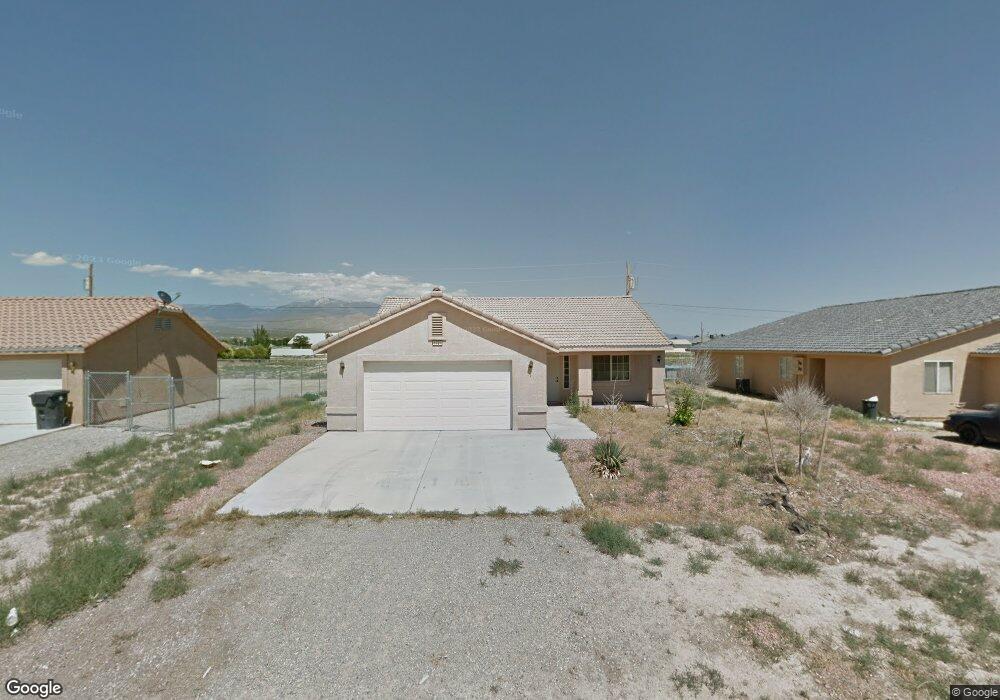
1731 Galaxy St Unit 7 Pahrump, NV 89048
Estimated Value: $288,000 - $303,000
3
Beds
2
Baths
1,302
Sq Ft
$227/Sq Ft
Est. Value
About This Home
This home is located at 1731 Galaxy St Unit 7, Pahrump, NV 89048 and is currently estimated at $295,460, approximately $226 per square foot. 1731 Galaxy St Unit 7 is a home located in Nye County with nearby schools including J.G. Johnson Elementary School, Rosemary Clarke Middle School, and Pahrump Valley High School.
Ownership History
Date
Name
Owned For
Owner Type
Purchase Details
Closed on
Sep 15, 2010
Sold by
Flagstar Bank Fsb
Bought by
Bayudan Gina
Current Estimated Value
Purchase Details
Closed on
May 27, 2010
Sold by
Cunningham Karry Allen
Bought by
Flagstar Bank Fsb
Purchase Details
Closed on
Jun 8, 2007
Sold by
Cunningham Joann Lee
Bought by
Cunningham Karry Allen
Home Financials for this Owner
Home Financials are based on the most recent Mortgage that was taken out on this home.
Original Mortgage
$184,000
Interest Rate
7.75%
Mortgage Type
Stand Alone Refi Refinance Of Original Loan
Purchase Details
Closed on
May 29, 2007
Sold by
Homes West Inc
Bought by
Cunningham Karry Allen
Home Financials for this Owner
Home Financials are based on the most recent Mortgage that was taken out on this home.
Original Mortgage
$184,000
Interest Rate
7.75%
Mortgage Type
Stand Alone Refi Refinance Of Original Loan
Purchase Details
Closed on
May 19, 2006
Sold by
Cunningham Allen
Bought by
Homes West Inc
Create a Home Valuation Report for This Property
The Home Valuation Report is an in-depth analysis detailing your home's value as well as a comparison with similar homes in the area
Home Values in the Area
Average Home Value in this Area
Purchase History
| Date | Buyer | Sale Price | Title Company |
|---|---|---|---|
| Bayudan Gina | $56,500 | Lawyers Title Of Nevada | |
| Flagstar Bank Fsb | $63,665 | Accommodation | |
| Cunningham Karry Allen | -- | Lawyers Title Of Nevada Inc | |
| Cunningham Karry Allen | -- | None Available | |
| Homes West Inc | -- | None Available |
Source: Public Records
Mortgage History
| Date | Status | Borrower | Loan Amount |
|---|---|---|---|
| Previous Owner | Cunningham Karry Allen | $184,000 |
Source: Public Records
Tax History Compared to Growth
Tax History
| Year | Tax Paid | Tax Assessment Tax Assessment Total Assessment is a certain percentage of the fair market value that is determined by local assessors to be the total taxable value of land and additions on the property. | Land | Improvement |
|---|---|---|---|---|
| 2025 | $1,217 | $51,358 | $2,689 | $48,669 |
| 2024 | $1,217 | $52,586 | $2,689 | $49,897 |
| 2023 | $1,217 | $48,492 | $2,689 | $45,803 |
| 2022 | $1,095 | $43,913 | $2,689 | $41,224 |
| 2021 | $1,066 | $41,775 | $2,151 | $39,624 |
| 2020 | $1,036 | $40,833 | $2,151 | $38,682 |
| 2019 | $1,006 | $48,920 | $2,151 | $46,769 |
| 2018 | $961 | $46,941 | $1,721 | $45,220 |
| 2017 | $924 | $37,728 | $1,721 | $36,007 |
| 2016 | $902 | $25,408 | $1,721 | $23,687 |
| 2015 | $862 | $23,547 | $1,721 | $21,826 |
| 2014 | $836 | $25,419 | $1,721 | $23,698 |
Source: Public Records
Map
Nearby Homes
- 1791 S Highland Ave
- 1150 Ibis St
- 1070 Ibis St
- 2160 S Highland Ave
- 1083 E Calvada Blvd
- 1561 S Highland Ave
- 1620 Pershing Ave
- 961 Kansas St
- 881 E Calvada Blvd
- 960 E Honeysuckle St
- 731 Jack Rabbit St
- 2240 Jacaranda St
- 1750 Pahrump Valley Blvd
- 1140 Grant St
- 2011 Sycamore Ave Unit A
- 931 Lone Pine Rd
- 790 Lone Pine Rd
- 1220 E Calvada Blvd
- 2000 E Calvada Blvd
- 1271 Honeysuckle St
- 1741 Galaxy St
- 1741 Galaxy St Unit B
- 1711 Galaxy St Unit 7
- 1710 Galaxy St
- 1710 Galaxy St Unit A
- 1710 S Galaxy Unit A
- 1710 S Galaxy Unit B
- 1701 S Galaxy Unit 2
- 1730 Sycamore Ave Unit B
- 1730 Sycamore Ave Unit A
- 1700 Sycamore Ave Unit B
- 1700 Sycamore Ave Unit A
- 1700 Sycamore Ave
- 1771 Galaxy St
- 1731 S Highland Ave
- 1711 S Highland Ave
- 1790 Galaxy St
- 1770 Sycamore Ave
- 1741 S Highland Ave
- 1711 Sycamore Ave Unit B