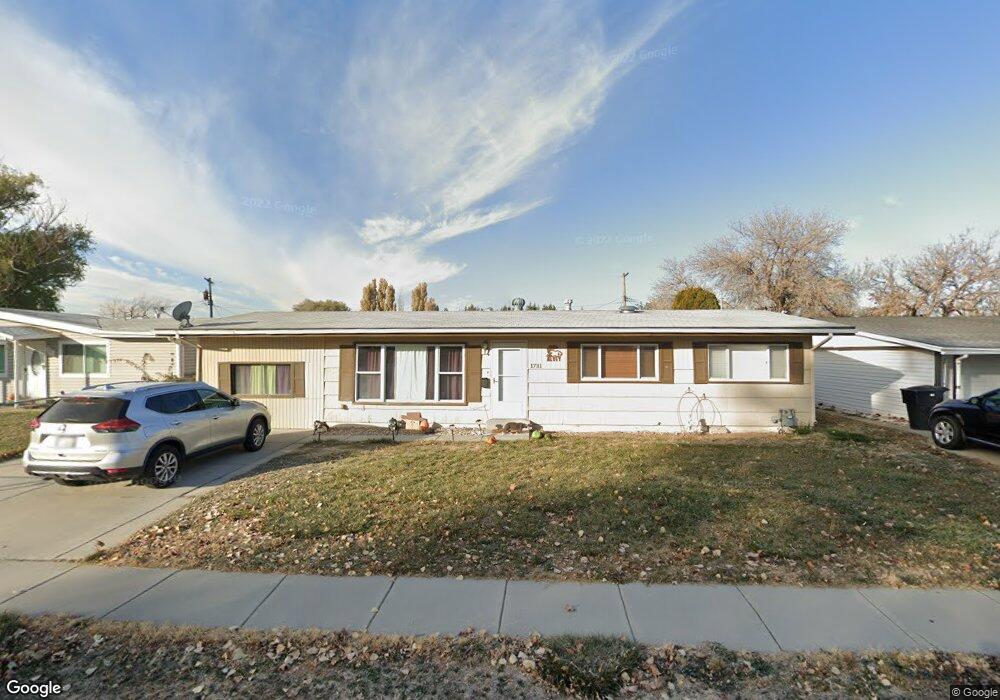
1731 N 400 W Clearfield, UT 84015
Estimated Value: $313,673
4
Beds
1
Bath
1,458
Sq Ft
$215/Sq Ft
Est. Value
About This Home
This home is located at 1731 N 400 W, Clearfield, UT 84015 and is currently estimated at $313,673, approximately $215 per square foot. 1731 N 400 W is a home located in Davis County with nearby schools including Sunset School, Sunset Junior High School, and Northridge High School.
Ownership History
Date
Name
Owned For
Owner Type
Purchase Details
Closed on
Dec 29, 2016
Sold by
Marshall Aubree
Bought by
Alvey James Daniel and Alvey Jessica
Current Estimated Value
Home Financials for this Owner
Home Financials are based on the most recent Mortgage that was taken out on this home.
Original Mortgage
$139,925
Outstanding Balance
$113,782
Interest Rate
3.75%
Mortgage Type
FHA
Estimated Equity
$199,891
Purchase Details
Closed on
Aug 7, 2012
Sold by
Silvernagel Wayne Anton and Silvernagel Deborah Ann
Bought by
Marshall Aubree
Home Financials for this Owner
Home Financials are based on the most recent Mortgage that was taken out on this home.
Original Mortgage
$3,888
Interest Rate
3.56%
Mortgage Type
Commercial
Purchase Details
Closed on
Jan 24, 2006
Sold by
Enderton Patricia and Silvernagel Patricia
Bought by
Silvernagel Wayne A
Create a Home Valuation Report for This Property
The Home Valuation Report is an in-depth analysis detailing your home's value as well as a comparison with similar homes in the area
Home Values in the Area
Average Home Value in this Area
Purchase History
| Date | Buyer | Sale Price | Title Company |
|---|---|---|---|
| Alvey James Daniel | -- | Backman Title | |
| Marshall Aubree | -- | First American Title | |
| Silvernagel Wayne A | -- | None Available |
Source: Public Records
Mortgage History
| Date | Status | Borrower | Loan Amount |
|---|---|---|---|
| Open | Alvey James Daniel | $139,925 | |
| Previous Owner | Marshall Aubree | $3,888 | |
| Previous Owner | Marshall Aubree | $97,206 |
Source: Public Records
Tax History Compared to Growth
Tax History
| Year | Tax Paid | Tax Assessment Tax Assessment Total Assessment is a certain percentage of the fair market value that is determined by local assessors to be the total taxable value of land and additions on the property. | Land | Improvement |
|---|---|---|---|---|
| 2025 | $1,929 | $176,000 | $75,188 | $100,812 |
| 2024 | $1,790 | $163,349 | $71,861 | $91,488 |
| 2023 | $1,671 | $152,900 | $63,089 | $89,810 |
| 2022 | $1,772 | $290,000 | $119,125 | $170,875 |
| 2021 | $1,534 | $217,000 | $71,012 | $145,988 |
| 2020 | $1,337 | $186,000 | $59,995 | $126,005 |
| 2019 | $1,247 | $178,000 | $75,518 | $102,482 |
| 2018 | $1,109 | $155,000 | $60,350 | $94,650 |
| 2016 | $954 | $68,475 | $28,539 | $39,936 |
| 2015 | $909 | $61,820 | $28,539 | $33,281 |
| 2014 | $891 | $61,957 | $28,539 | $33,418 |
| 2013 | -- | $55,436 | $23,265 | $32,171 |
Source: Public Records
Map
Nearby Homes
- 1746 N 475 W
- 1721 N 400 W
- 1696 N 475 W
- 1623 N 400 W
- 36 W 1600 N
- 1874 N 200 W
- 1534 N 300 W
- 1438 N 475 W
- 312 W 1425 N
- 1443 N 200 W
- 1378 N 300 W
- 1974 N 75 W
- 1647 N Main St
- 2177 N 450 W
- 31 W 1600 N
- 52 W 2000 N
- 2085 N Main St Unit 409
- 2085 N Main St Unit 108
- 2085 N Main St Unit 401
- 2085 N Main St Unit 308